Figure 3.
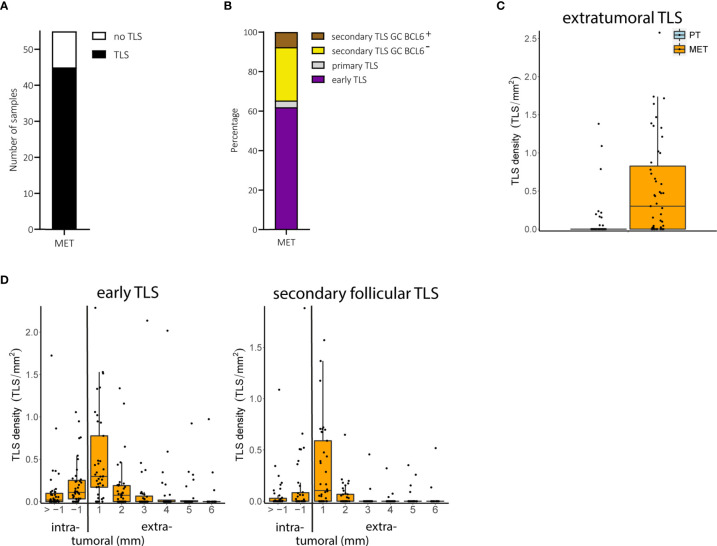
Melanoma metastases (MET): TLS phenotypes, density and spatial distribution. (A) Prevalence of TLS in metastatic tumor samples. (B) Relative prevalence of TLS phenotypes in melanoma metastases. (C) Comparison of extratumoral TLS density with primary melanomas. (D) Densities of early TLS (left) and secondary follicular TLS (right) over intra- and extratumoral compartments of metastatic tumors. In all boxplots, lower and upper hinges correspond to the first and third quartiles, center line to the median. Upper and lower whisker extend from the hinge to the largest value no further than 1.5 times the interquartile range. Values outside this range are shown as outliers (black circles). Individual patient values are shown as black dots. TLS, tertiary lymphoid structures; GC, germinal center.

