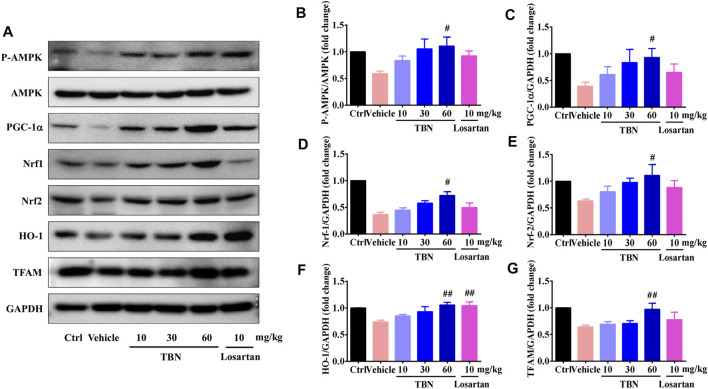
FIGURE 7.
TBN upregulated p-AMPK, PGC-1α, Nrf1, Nrf2, HO-1, and TFAM expression in both STZ-induced rats. (A) Representative Western blots illustrating the expression of p-AMPK, total AMPK, PGC-1α, Nrf1, Nrf2, HO-1, and TFAM in the renal cortices of STZ-induced rats. Bar graphs showing mean Western blot of p-AMPK/AMPK (B), PGC-1α/GAPDH (C), Nrf1/GAPDH (D), Nrf2/GAPDH (E), HO-1/GAPDH (F), and TFAM/GAPDH (G) in the renal cortices of STZ-induced rats. Data are means ± SEM of six rats per group. Significance was determined by one-way ANOVA followed by Tukey’s test. *p < 0.05 and **p < 0.01 vs. Ctrl group. # p < 0.05 and ## p < 0.01 vs. vehicle treated-STZ model group.

