Figure 3.
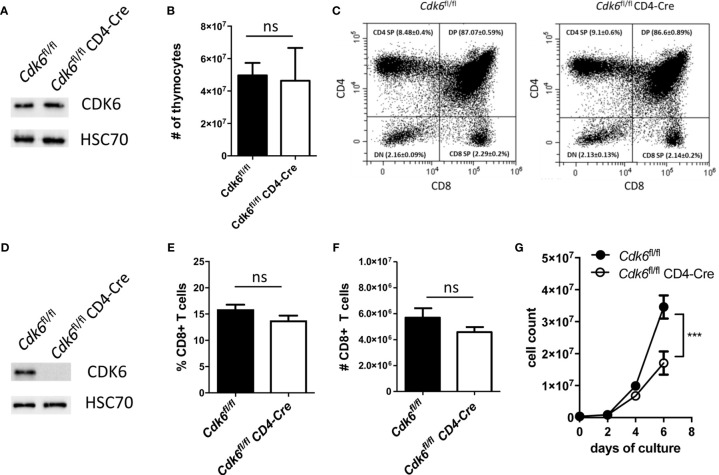
Cdk6fl/fl CD4-Cre mice do not show a defect in thymic T cell development and splenic CD8+ T cell numbers, while in vitro expansion of CD8+ T cells is impaired. (A) Thymocytes were lysed from Cdk6 fl/fl and Cdk6 fl/fl CD4-Cre mice for western blot analysis of CDK6 protein levels. HSC70 served as a loading control. (B) Absolute numbers of thymocytes were analyzed in Cdk6 fl/fl and Cdk6 fl/fl CD4-Cre mice (n=4-7). (C) The frequencies of CD4/CD8 double-negative (DN), CD4/CD8 double-positive (DP), CD4 single-positive (CD4 SP) and CD8 single-positive (CD8 SP) thymocytes were analyzed by flow cytometry in Cdk6 fl/fl CD4-Cre mice and Cdk6 fl/fl controls (n=4-7). Representative dot plots are shown. Figure S2A shows the corresponding bar graph with mean ± SEM values. (D) Splenic CD8+ T cells from Cdk6 fl/fl and Cdk6 fl/fl CD4-Cre mice were cultured for six days and lysed for western blot analysis of CDK6 protein levels. HSC70 served as a loading control. (E, F) Percentage (E) and total numbers (F) of splenic CD3+CD8+ T cells were analyzed by flow cytometry in Cdk6 fl/fl and Cdk6 fl/fl CD4-Cre mice (n=7-9). (G) Splenic CD8+ T cells were isolated from Cdk6 fl/fl and Cdk6 fl/fl CD4-Cre mice, activated with αCD3/αCD28 for 48h and cultured in the presence of IL-2. Numbers of CD8+ T cells were analyzed every two days during the culture (n=4). (B, E, F) Bar graphs represent mean ± SEM, pooled from 2-3 independent experiments. (G) Symbols in growth curves represent mean ± SEM, pooled from two independent experiments; ***p < 0.001 (for comparison on d6), two-way ANOVA. ns, not significant.

