Figure 4.
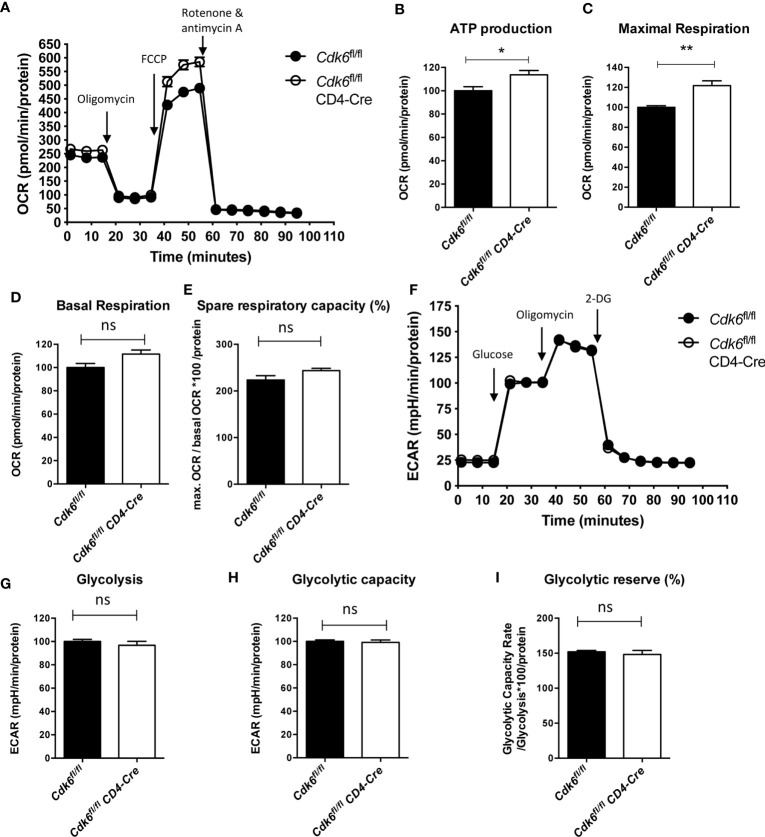
Loss of CDK6 increases mitochondrial respiration of CD8+ T cells in vitro. Naïve CD8+ T cells were isolated from spleens of Cdk6fl /fl and Cdk6fl /fl CD4-Cre mice and cultured for 48h on αCD3/αCD28 coated wells in presence of IL-2. (A–E) Agilent Seahorse XF Cell Mito Stress Test was performed with cultured CD8+ T cells. (A) Oxygen consumption rate (OCR) curves are shown. Injections of oligomycin (Injection 1), FCCP (Injection 2) and rotenone and antimycin A (Injection 3) are indicated by arrows. ATP production (B), maximal respiration (C), basal respiration (D) and spare respiratory capacity (as %) (E) were calculated for Cdk6 fl/fl and Cdk6 fl/fl CD4-Cre CD8+ T cells (n=4). (F–I) Agilent Seahorse XF Glycolysis Stress Test was performed with cultured CD8+ T cells. (F) Extracellular acidification rate (ECAR) curves are shown. Injections of glucose (Injection 1), oligomycin (Injection 2) and 2-deoxy-glucose (2-DG) (Injection 3) are indicated by arrows. Glycolysis (G), glycolytic capacity (H) and glycolytic reserve (as %) (I) were calculated for Cdk6 fl/fl and Cdk6 fl/fl CD4-Cre CD8+ T cells (n=4). (B–E, G–I) Bar graphs represent mean ± SEM, pooled from two independent experiments. **p < 0.01, *p < 0.05, unpaired t-test. (A, F) Symbols in curves represent mean ± SEM (n=4 biological replicates per genotype with 8 technical replicates). ns, not significant.

