Figure 5.
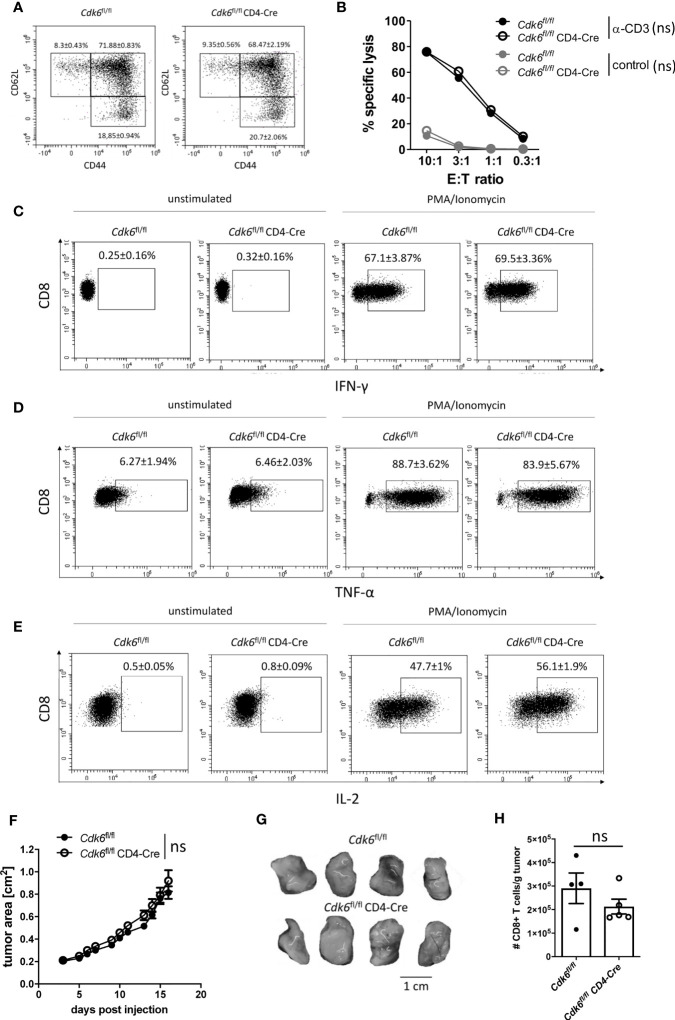
T cell-intrinsic loss of CDK6 does not affect MC38 tumor growth in vivo. (A–E) Splenic CD8+ T cells were isolated from Cdk6 fl/fl and Cdk6 fl/fl CD4-Cre mice, activated with αCD3/αCD28 for 48h and cultured in the presence of IL-2. (A) Percentages of naïve (CD62L+CD44-), central memory (CD62L+CD44+) and effector memory (CD62L-CD44+) CD8+ T cells were analyzed after six days of culture by flow cytometry (n=4). Representative dot plots are shown. Figure S3A shows the corresponding bar graph with mean ± SEM values, pooled from two independent experiments. (B) Redirected cytotoxicity assay with the P815 target (T) cell line was performed with Cdk6 fl/fl and Cdk6 fl/fl CD4-Cre CD8+ T cells six days upon culture as effector (E) cells. Cells were incubated at different E:T ratios for 3h in the presence of αCD3 or with an FcR-blocking reagent (control). Specific lysis of CFSE-labeled target cells was analyzed by flow cytometry (n=2). (C–E) Cultured Cdk6 fl/fl and Cdk6 fl/fl CD4-Cre CD8+ T cells were kept unstimulated or stimulated with PMA/Ionomycin for 4h and percentages of IFN-γ (C), TNF-α (D) and IL-2 (E) positive CD8+ T cells were analyzed by intracellular flow cytometric staining (n=4-5). Representative dot plots are shown. Figure S3E–G show the corresponding bar graphs with mean ± SEM values, pooled from two independent experiments. (F–H) Cdk6 fl/fl and Cdk6 fl/fl CD4-Cre mice were injected subcutaneously into both flanks with 106 MC38 tumor cells. (F) Growth of the tumors was monitored by assessment of tumor area every 1-2 days. (G) Representative tumor pictures are shown. Figure S3H shows the bar graph with the corresponding tumor weights (n=4-5 mice per genotype (8-10 tumors per genotype)). (H) Absolute numbers (normalized to tumor weight) of tumor-infiltrating CD8+ T cells were analyzed by flow cytometry (n=4-5). (B, F) Symbols represent mean ± SEM from one experiment. (H) Bar graph represents mean ± SEM with symbols representing values from individual tumors from one experiment. ns, not significant.

