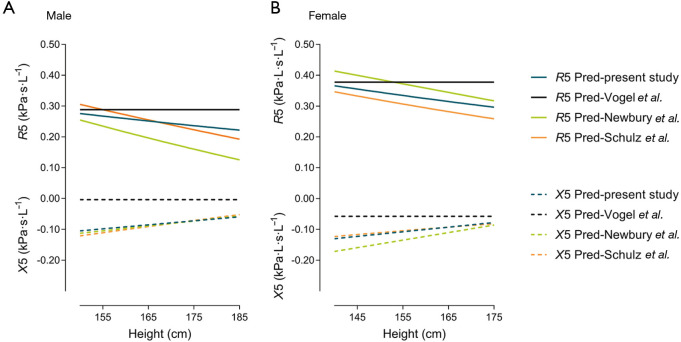
Figure 3.
Comparison of the Pred of R5 and X5 predicted by different equations. Results are shown as a function of height, with age fixed at 50 years, and weight was calculated by a fixed BMI of 23 kg/m2 (the median of our study population). Solid lines indicate Pred of R5, and dashed lines indicate Pred of X5. Pred, predictive values; BMI, body mass index.

