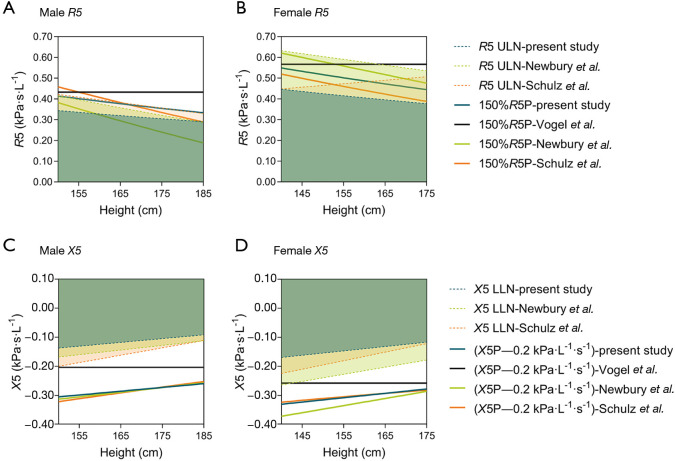
Figure 4.
Comparisons of the normal ranges of R5 and X5 derived by different equations. Colored area under the dotted lines indicates ULN of R5 or LLN of X5. Solid lines indicate 150% R5P or the predictive values of X5 minus 0.2 kPa·s·L–1 (X5P–0.2 kPa·s·L–1). As the RSD of Vogel’s equations is not available, the ULN/LLN with Vogel’s equations is not shown. ULN, upper limit of normal; LLN, lower limit of normal; 150% R5P, 150% of the predictive values of R5; RSD, residual standard deviation.

