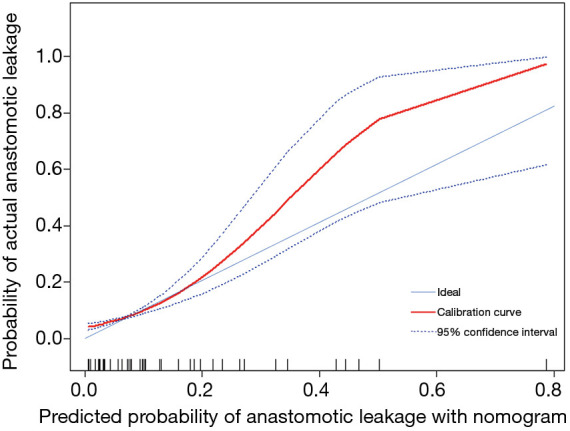
Figure 4.

Calibration curve of nomograph. The red line represents the actual incidence of anastomotic leakage at different predictive probabilities. The blue solid line represents the situation where the predicted probability is exactly the same as the actual probability. In fact, it describes the fitting between the predicted probability and the actual probability, which is the calibration of the model.
