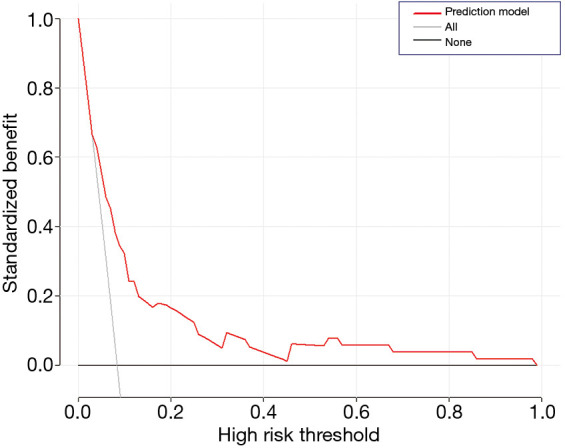
Figure 5.

Decision curve for nomogram model to predict the risk of postoperative anastomotic leakage in patients with esophageal cancer. The graph shows the clinical net benefit of patients with anastomotic leakage defined by different threshold probabilities. Dotted line: assume all patients have anastomotic leakage. Grey thin line: assume no patients have anastomotic leakage.
