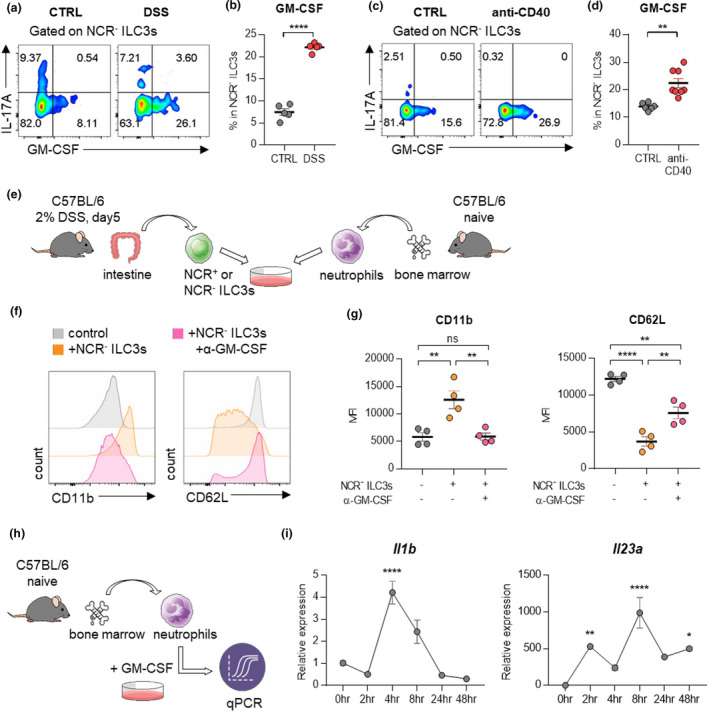
Figure 5.

NCR‐ ILC3s activate neutrophils by producing GM‐CSF. (a) Cells isolated from the colon of mice with DSS‐induced colitis were stimulated with PMA and ionomycin, and cytokine production was analysed by intracellular cytokine staining. (b) The percentage of GM‐CSF‐producing NCR‐ ILC3s. Data are presented as mean ± SEM (Student’s t‐test). Data are representative of three independent experiments with n = 5 per group. (c) Cells isolated from the colon of mice with anti‐CD40‐induced colitis were stimulated with PMA and ionomycin, and cytokine production was analysed by intracellular cytokine staining. (d) The percentage of GM‐CSF‐producing NCR‐ ILC3s. Data are presented as mean ± SEM (Student’s t‐test). Data are representative of two independent experiments with control (n = 7) and anti‐CD40 (n = 8). (e) Schematic diagram of the co‐culture procedure of ILC3s and neutrophils. (f, g) Neutrophils and NCR‐ ILC3s were co‐cultured with or without anti‐GM‐CSF antibodies for 24 hours. Histogram (f) and MFI (g) of CD11b and CD62L expression on neutrophils. Data are presented as mean ± SEM (one‐way ANOVA). Data are representative of three independent experiments with n = 4 per group. (h) Schematic diagram of the stimulation procedure of neutrophils with GM‐CSF. Neutrophils were isolated from bone marrow from naïve mice, then stimulated with recombinant GM‐CSF. (i) The level of mRNA expression of Il1b and Il23a was measured at the indicated time point. Data are normalised to Gapdh. Data are presented as mean ± SEM (one‐way ANOVA). Data are representative of three independent experiments with n = 3 per group.*P < 0.05, **P < 0.01 and ****P < 0.001, and ns, not significant (P > 0.05).
