Figure 4.
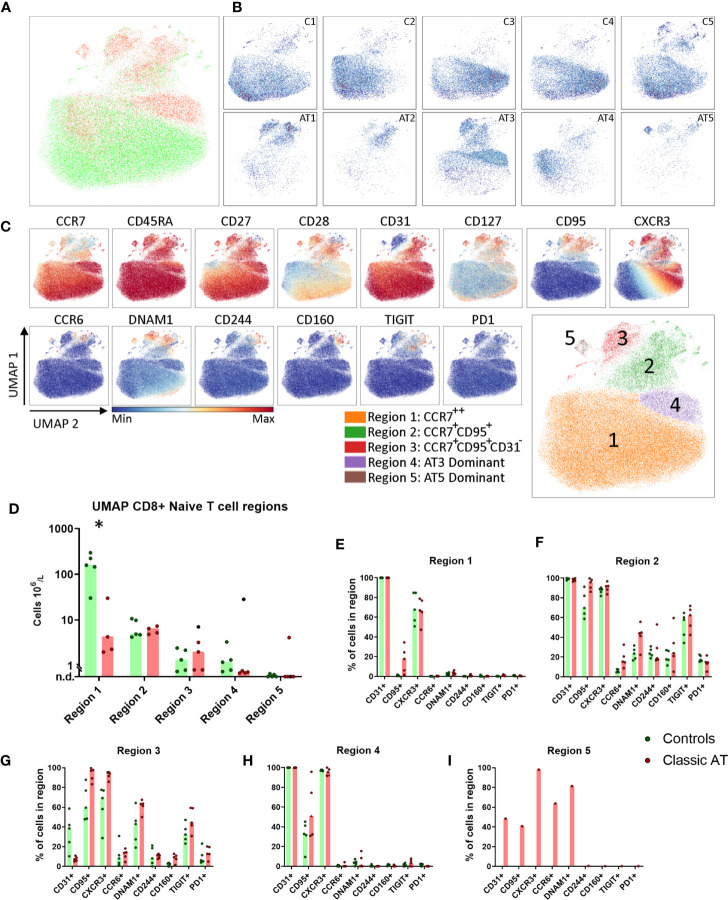
UMAP of naive CD8 T cells highlights reduced CD31+ cells, but comparable numbers of stem cell memory T cells. (A) UMAP plot of CD8 naive T cells, showing the cells of the classic AT patients (red; 24769 cells) positioned on top of controls (green; 61945 cells). (B) Individual UMAP density plots for each sample, on the top row controls and on the bottom row Classic AT. The density plots indicate clear differences in cell distributions between individual samples in both groups. (C) Fluorochrome intensities superimposed on the UMAP embedding for a subset of markers (All markers shown in Figures S6A, B ). Based on these marker intensities, the overlay in A and individual sample plots in B, we defined 5 regions, as shown in the bottom-right plot: CCR7++ (Region 1), CCR7+CD95+ (Region 2), CCR7+CD95+CD31- (Region 3), AT3 Dominant (Region 4) and AT5 Dominant, or exclusive (Region 5). (D) Absolute counts of cells within each region, visualized in bars graphs (median) and individual closed circles of the classic AT (red) and controls (green). (E–I) Bar graphs (median) and individual closed circles of the classic AT (red) and controls (green) showing the percentage of Boolean gating defined positive cells in each region. * means P < 0.05.

