Figure 6.
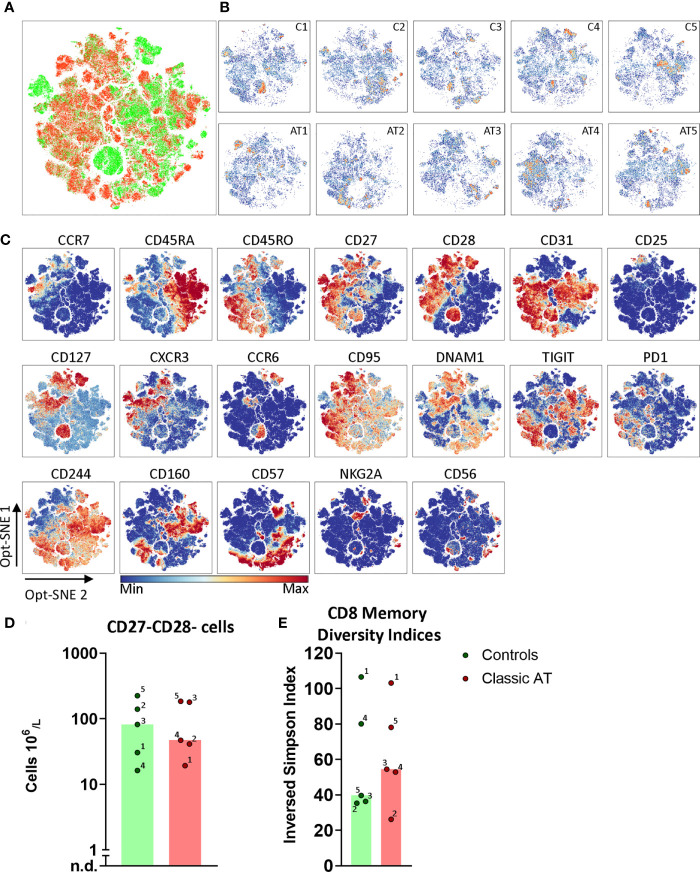
Opt-SNE and phenotypical diversity indices in the CD8 memory compartment reveals similar heterogeneity in classic AT and controls. (A) CD8 memory T cells Opt-SNE plot, showing the cells of the classic AT (red) patients positioned on top of controls (green). (B) Individual Opt-SNE density plots for each sample, on the top row controls and on the bottom row classic AT. (C) Fluorochrome intensities superimposed on the Opt-SNE embedding for a subset of markers (All markers shown in Figures S8A, B ). (D) Bars (median) and individual closed circles of the classic AT (red) and controls (green) showing the calculated absolute blood cell count of Boolean gating defined CD27-CD28- T cells. (E) The diversity or inversed Simpson index of the CD8 memory T cells is shown as bars (median) and individual closed circles of the classic AT (red) and controls (green) The index was calculated based on the Boolean gating of the following markers: CD28, CD27, DNAM1, CD57, CD244, CD56, PD1, CD160, TIGIT, NKG2A, CCR6, CXCR3, CCR7 and CD25. In total 16384 possible phenotypes were analyzed, of which 3396 were present in the CD8 memory T cells.

