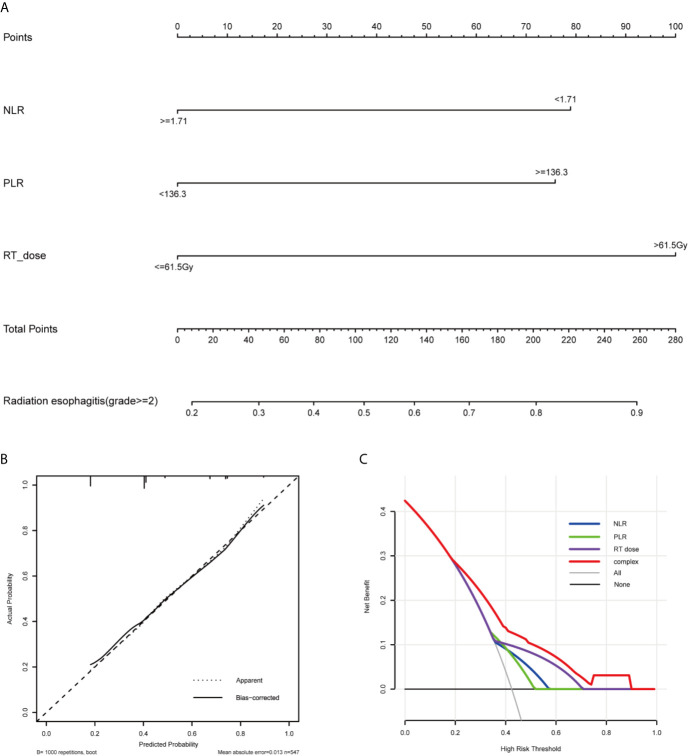
Figure 2.
Nomogram, calibration curve, and Decision curve for predicting the probability of grade ≥2 RE for the whole study population. (A) A nomogram that integrates RT dose, NLR, and PLR in ESCC patients. (B) The calibration curve of the nomogram predicting the occurrence of grade ≥2 RE. The x-axis and y-axis indicate the predicted and actual probabilities of having grade ≥2 RE, respectively. A 45° line represented optimal predictive values. (C) The decision curves of the nomogram predicting the occurrence of grade ≥2 RE. The x-axis shows the threshold probabilities. The y-axis measures the net benefit, which is calculated by subtracting the false positives and adding the true positives. The horizontal line along the x-axis assumes that no patient will have grade ≥2 RE whereas the solid gray line assumes that all patients will have grade ≥2 RE at a specific threshold probability. The blue, green, purple and red line represents the net benefit of using the NLR, PLR, RT dose, and complex, respectively. RE, radiation esophagitis; RT, radiotherapy; NLR, neutrophils-lymphocyte ratio; PLR, platelets-lymphocytes ratio.

