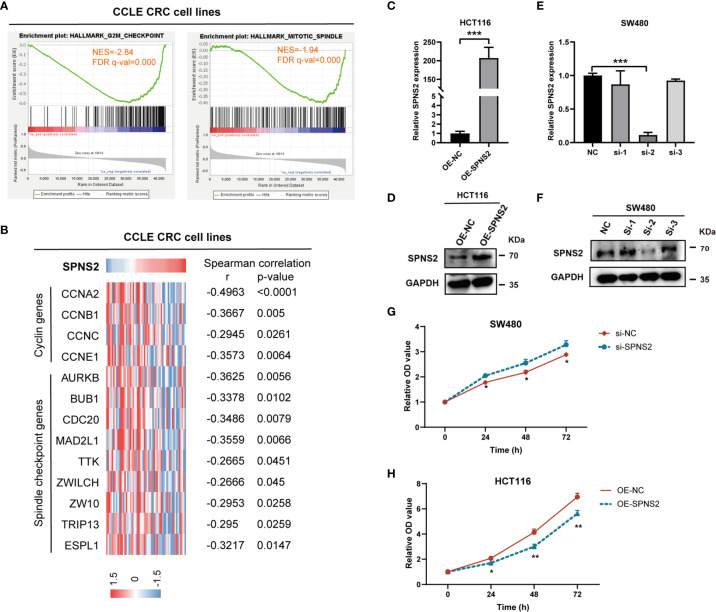
Figure 5.
SPNS2 inhibits proliferation of CRC cells. (A) GSEA analysis of SPNS2 expression in CCLE CRC cell lines showed that SPNS2 expression negatively correlated with “HALLMARK G2M CHECKPOINT” and “HALLMARK MITOTIC SPINDLE”. NES, normalized enrichment score; FDR, false discovery rate. (B) Correlation of SPNS2 mRNA expression with expression of cell cycle related genes in CCLE CRC cells. Expression of cell cycle related genes, including 4 cyclin genes and 9 spindle checkpoint genes, are visualized colorimetrically with heatmap, in which rows represent genes and columns represent CRC cell lines. ‘Red’ representing high gene expression, ‘blue’ representing low gene expression. Statistical analyses were performed by Spearman’s correlation. (C, D) The RNA and protein level of SPNS2 determined by qRT-PCR and WB in HCT116 cells overexpressing SPNS2. (E, F) siRNA mediated silence of SPNS2 expression in SW480 cells. (G, H) CCK8 assay were performed to analyze the effect of SPNS2 overexpression or knockdown on CRC cell proliferation in vitro. NC: negative control for siRNA; si: siRNA silencing; OE-NC: negative control for overexpression; OE-SPNS2: SPNS2 overexpression. Statistical analyses were performed by Student’s t-test. ***P < 0.001, **p < 0.01, *p < 0.05.

