Figure 7.
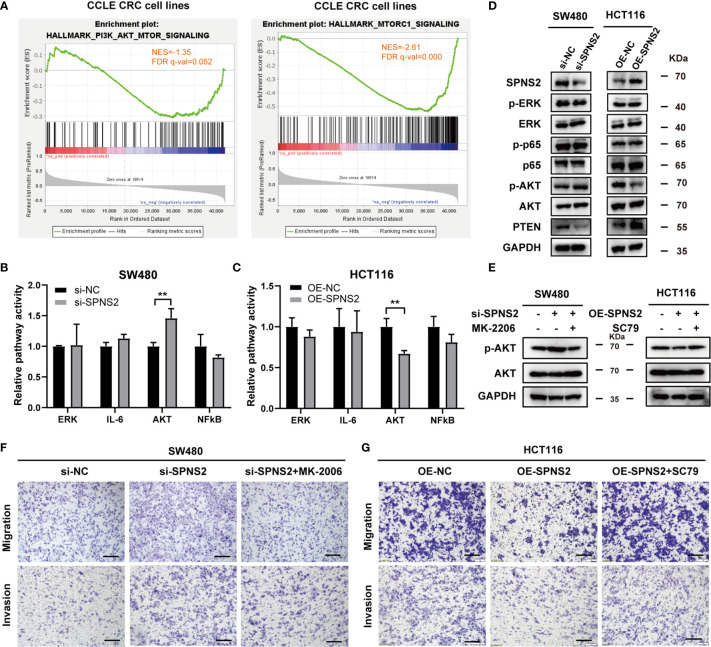
Effects of SPNS2 on the AKT signaling pathway. (A) GSEA analysis in CCLE CRC cell lines showed that SPNS2 expression negatively correlated with “HALLMARK PI3K AKT MTOR SIGNALING” and “HALLMARK MTORC1 SIGNALING”. (B, C) The relative activities (mean ± S.D.) of AKT, ERK, STAT3, and NF-κB pathways were determined via Qiagen reporter luciferase assay in SPNS2-overexpressing HCT116 cells or SPNS2 knockdown SW480 cells versus the NC counterparts. **p < 0.01 (D) A representative western blot of total AKT, phosphorylated AKT (Ser473), ERK, phosphorylated ERK, P65 and phosphorylated P65 in the indicated CRC cells. (E) MK2206 reduced the phosphorylation level of AKT in SW480 si-SPNS2 cells and SC79 enhanced the phosphorylation level of AKT in HCT116 OE-SPNS2 cells. (F) MK2206 reduced cell migration and invasion in SW480 si-SPNS2 cells (scale bar = 100 µm). (G) SC79 enhanced cell migration and invasion in HCT116 OE-SPNS2 cells (scale bar = 100 µm).

