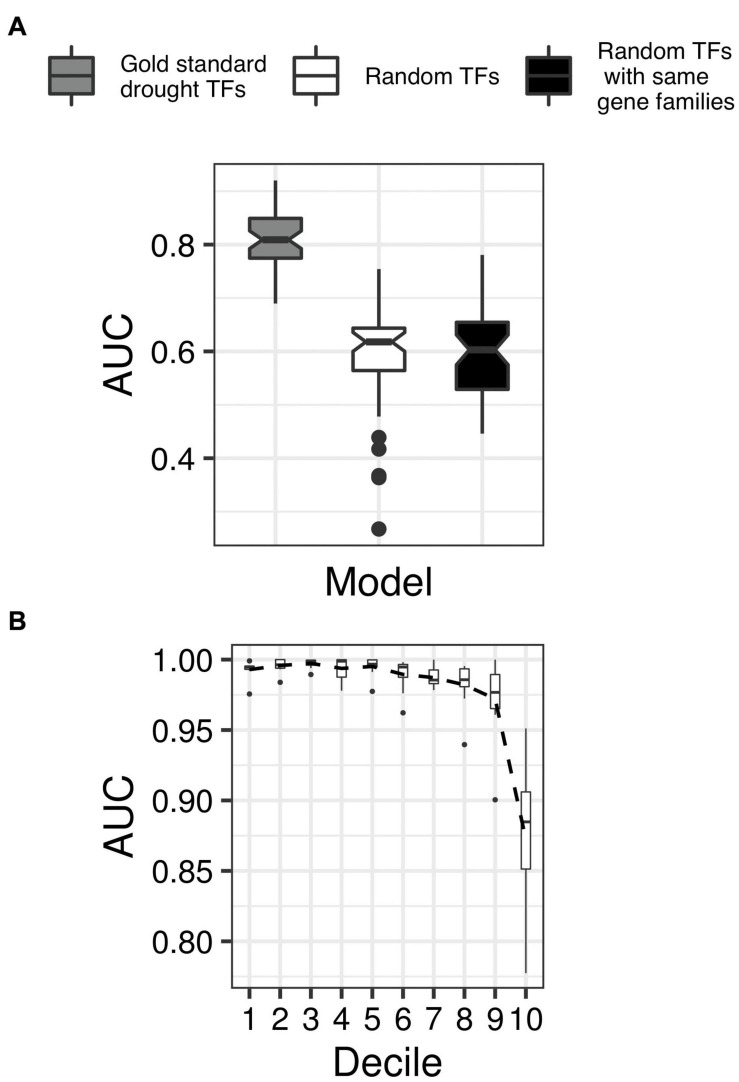
FIGURE 5.
Cross-validation of the network-based classifier. (A) Boxplots showing the distribution of the area under the precision-recall curve (AUC-PR; y-axis) in ten independent runs of fivefold cross-validation tests of the classifier trained using gold standard drought TFs (shaded gray), the classifier trained using randomly picked TFs instead of gold standard TFs (shaded white), and the classifier trained using randomly chosen TFs but from the same families like that of the gold standard examples (shaded black). The non-overlapping notches in the boxplots indicate significant differences in the median AUC-PR for all three classifiers. (B) TFs were sorted according to their decreasing order of drought scores assigned by the final classifier and grouped into 100 equal-sized bins. Expression levels (transcript per million units) of TFs in each bin were then used as features to classify a set of labeled RNA-seq samples as drought or control (data from GSE74793). Each boxplot shows the distribution of AUC-ROC (x-axis) from threefold cross-validation tests in groups of ten bins, with lower-numbered bins (y-axis) indicating TFs with higher drought scores. The black dotted line connects the mean of each decile’s AUC-ROC scores, indicating decreasing AUC-ROC with lower drought scores.

