FIGURE 2.
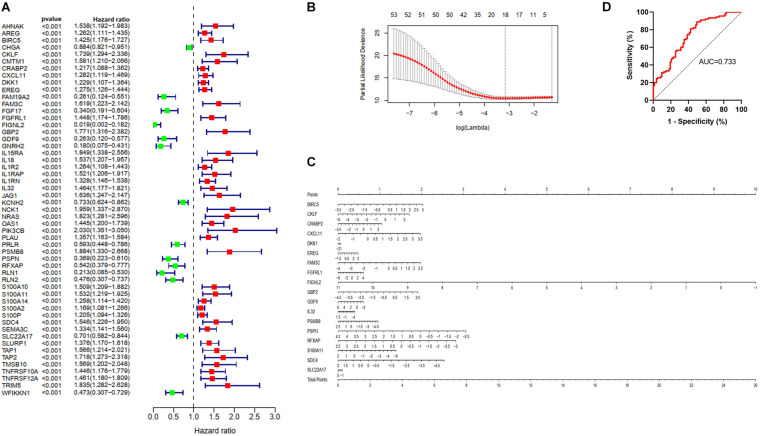
Identification and validation of the immune predictive model. (A) A forest plot showing associations between the 53 proteins whose p value were less than 0.001 and overall survival in the training group. Unadjusted hazard ratios are shown with 95% confidence intervals. (B) The cross-test for selecting parameters in the LASSO model. Lambda represents the selected parameters, and partial likelihood deviance is plotted against log (lambda). (C) Nomogram predicting the probability overall survival. Eighteen genes were used to assign the points and draw a line depending on the corresponding values. “Total points,” The sum of these 18 genes’ points makes up the “Total points” and can predict overall survival. (D) The ROC curve of the TCGA (n = 173) training model for predicting patients’ overall survival.

