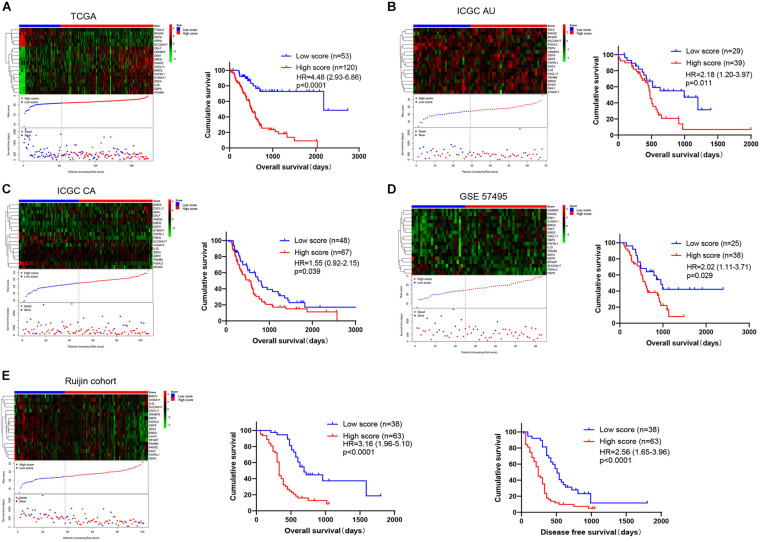
FIGURE 3.
The distribution and Kaplan-Meier survival curves of the immunity-related 18-gene signature depends on the patients’ risk score. The risk score for all patients with PDAC were plotted in ascending order and marked as low score (blue) or high score (red). The survival status of the patients is marked as dead (red) and alive (blue). The proportion of patients who died in the high score group is obviously higher compared with that in the low score group. (A) TCGA (n = 173), (B) ICGC AU (n = 68), (C) ICGC CA (n = 115), (D) GSE57495 (n = 63), and (E) Ruijin cohort (n = 101) are shown, respectively, and the Ruijin cohort also exhibited the DFS.

