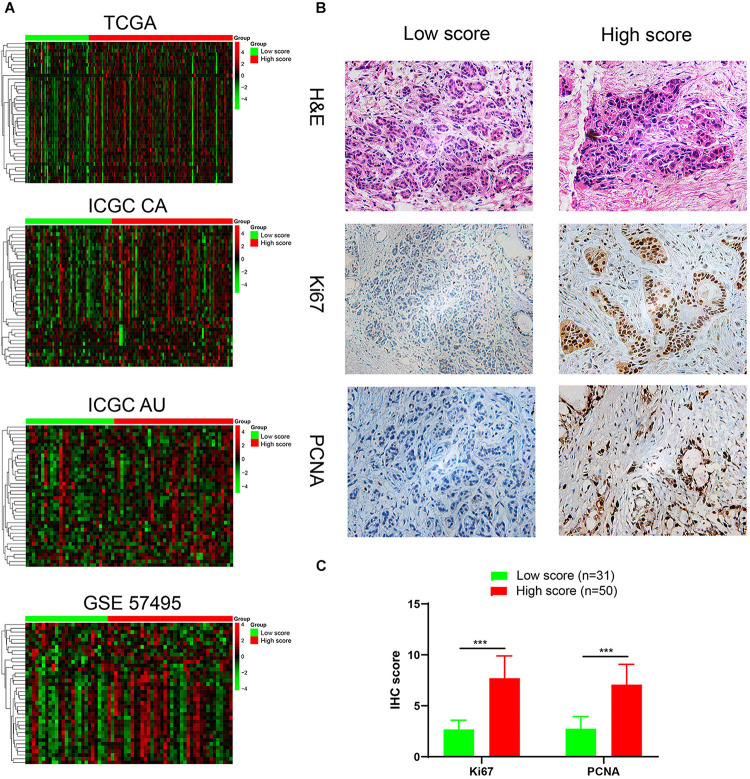
FIGURE 6.
Identification and validation of a highly proliferative subgroup of PDAC. (A) Heatmap showed that G1/S transition pathway was obviously enriched in high score group. We used kmeans clustering to draw heatmaps, and the lines left to heatmaps represent that the genes at ends of the lines had a high correlation. And the gene names in each row from top to bottom are ANXA1, AURKA, BCAT1, C10orf99, CCNA2, CCNB1, CCND1, CCNE1, CDC25C, CDC45, CDC6, CDK1, CDK2, CDK2AP2, CDK6, CDKN3, CDT1, E2F1, E2F7, E2F8, EGFR, EIF4EBP1, EZH2, GMNN, GTSE1, IQGAP3, KIF14, MCM10, MCM2, MCM4, MUC1, ORC1, ORC6, PML, PSME2, RCC1, RRM2, SFN, TNKS1BP1, TYMS. (B) H&E staining and immunohistochemical analyses of Ki-67, PCNA were performed on the tumor sections (low score group, n = 31; high score group, n = 50) (C) The IHC scores of Ki-67 and PCNA in low score (n = 31) and high score (n = 50) groups. ***P < 0.001.

