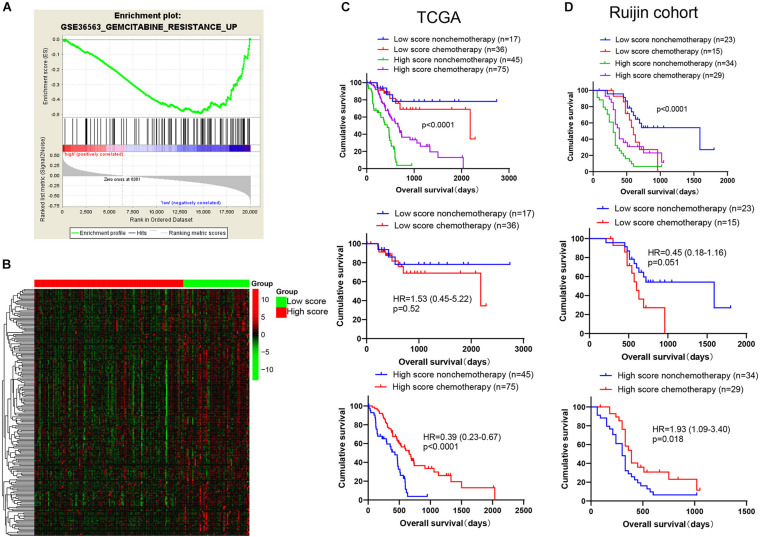
FIGURE 7.
Benefit of gemcitabine-based chemotherapy among patients in high and low score groups. (A) The gemcitabine resistance related gene set was significantly enriched in the low score group of TCGA cohort by GSEA analysis. The green curve represents enrichment score (ES). The highest point was used to represent ES value in gemcitabine resistance pathway. The ES value indicates the correlation between gene and gemcitabine resistance pathway. The black bar codes represent genes in gemcitabine resistance pathway and these genes were ordered according to their expression levels. The left end or right end genes are leading edge subset strongly contributed to ES value. The bottom numbers represent the order of expression levels in the genome from highest to lowest. (B) The 198 gemcitabine resistance-related genes were significantly attenuated in high score group of TCGA cohort (p < 0.05). Patients from the (C) TCGA database (n = 173) and (D) Ruijin cohort (n = 101) are divided into four groups (TCGA, Low score non-chemotherapy, n = 17, Low score chemotherapy, n = 36, high score non-chemotherapy, n = 45, high score chemotherapy, n = 75; Ruijin, Low score non-chemotherapy, n = 23, Low score chemotherapy, n = 15, high score non-chemotherapy, n = 34, high score chemotherapy, n = 29) and then Kaplan-Meier survival curves were plotted.

