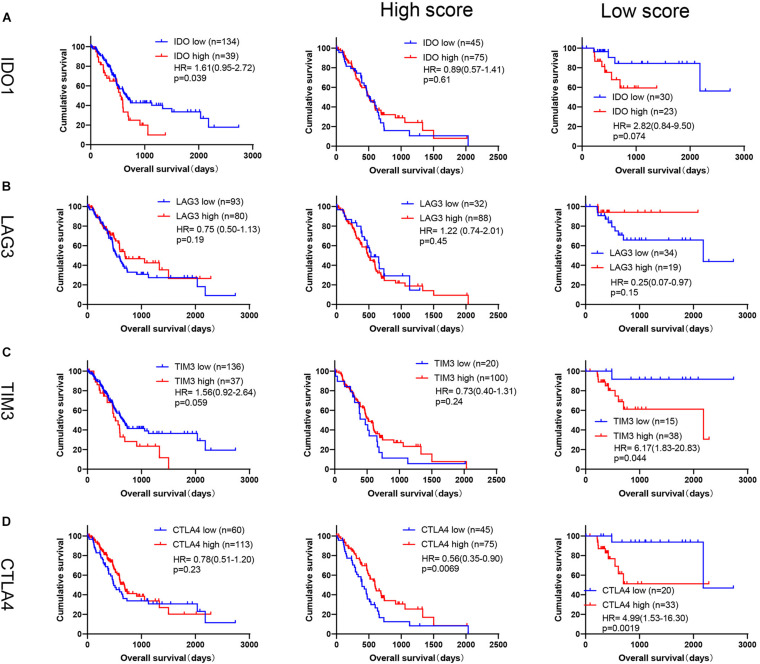
FIGURE 9.
Prognosis analysis of TIM3, CTLA4, IDO1 and LAG3 in TCGA database. Kaplan-Meier survival curves of (A) IDO1 (High score: PD-L1 high, n = 75; PD-L1 low, n = 45. Low score: PD-L1 high, n = 23; PD-L1 low, n = 30), (B) LAG3 (High score: PD-L1 high, n = 88; PD-L1 low, n = 32. Low score: PD-L1 high, n = 19; PD-L1 low, n = 34), (C) TIM3 (High score: PD-L1 high, n = 100; PD-L1 low, n = 20. Low score: PD-L1 high, n = 38; PD-L1 low, n = 15), (D) CTLA4 (High score: PD-L1 high, n = 75; PD-L1 low, n = 45. Low score: PD-L1 high, n = 33; PD-L1 low, n = 20) expression in all patients, or by subgroup analysis based on our immune signature in TCGA database.

