Figure 1.
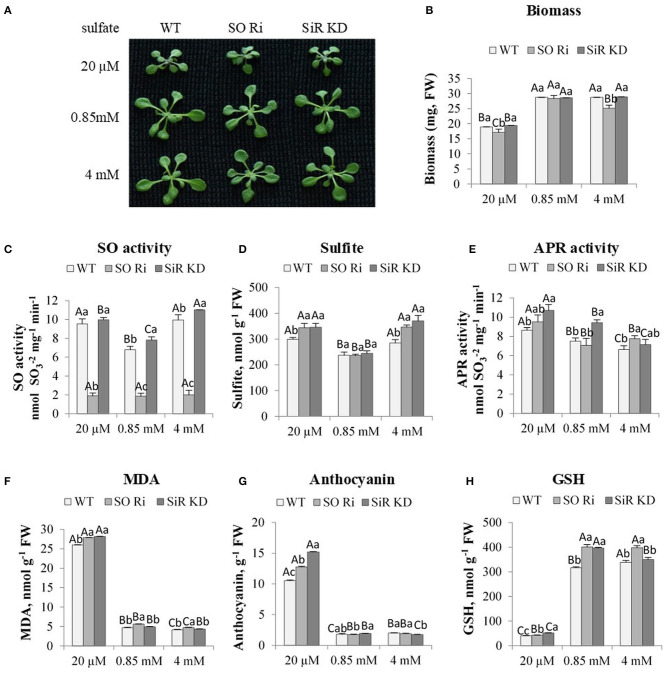
The effect of starvation (20 μM), normal (0.85 mM) and excess (4 mM) sulfate treatment on biomass accumulation, SO activity, S containing metabolites and oxidative stress indicators levels in wild-type (WT), sulfite reductase (SiR), and sulfite oxidase (SO) impaired plants. (A) Plants appearance. Plants were photographed on the ninth day after transfer to 0.5 MS plates containing the supplemented sulfate as the only S source. (B) Total biomass accumulation of plants upper part. Values are means (n = 20 plants) in one of six independent experiments with similar results. (C) SO activity. (D) Sulfite level. (E) APR activity. (F) Malondialdehyde (MDA) (the product marker of lipid peroxidation), (G) Anthocyanin, and (H) Reduced glutathione (GSH) level. Values for (C,H) represents one of three independent experiments with similar results (±SE, n = 3). Values for (D–G) represent the means of three independent experiments (±SE, n = 3). Different lower-case letters indicate differences between genotypes within the same treatment. Different uppercase letters indicate significant differences within the plant genotypes in response to treatment (Tukey–Kramer HSD test; JMP 8.0 software).

