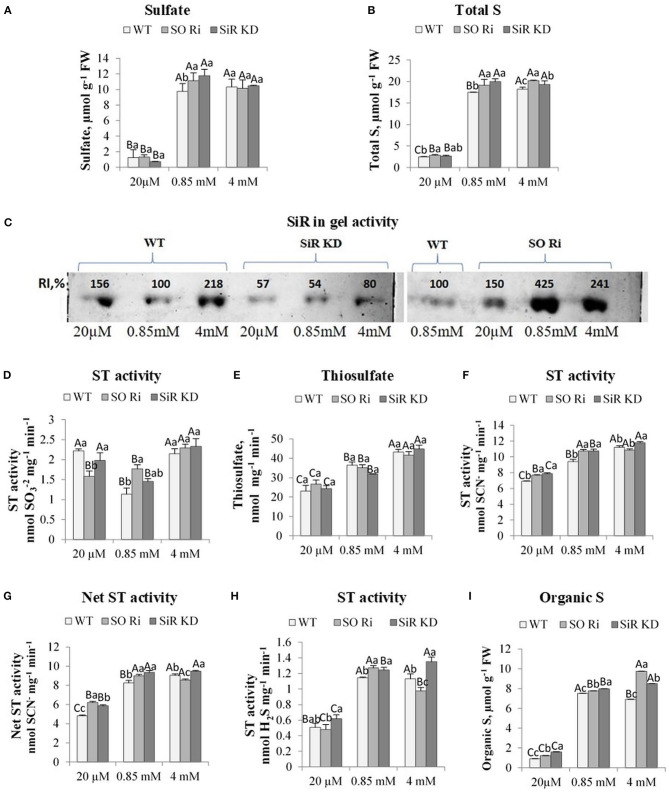
Figure 2.
The effect of starvation (20 μM), normal (0.85 mM), and excess (4 mM) sulfate treatment on the levels of sulfate, thiosulfate, total, and organic S, sulfite reductase (SiR), and sulfurtransferases (STs) activities in wild-type (WT) and (SiR) and sulfite oxidase (SO) impaired plants. (A) Sulfate and (B). Total sulfur (S) levels. (C) SiR in-gel activity after crude protein extracts fractionation by NATIVE-PAGE. Each lane contained 10 μg of proteins. Two separate gels with three treatments including control detected together are presented. The crude proteins extracted from WT leaves in plants treated with 0.85 sulfate was loaded to the two gels, and the intensity of the detected SiR activities was used as the control (100%) for each of the two gels. RI represents relative intensity (%) to the activity of WT treated with 0.85 sulfate. (D) STs sulfite consumption activity. (E) Thiosulfate level. (F) STs sulfite producing activity. (G) The net STs activity (calculated as the difference between sulfite-producing and sulfite-consumption activities). (H) STs sulfide generation activity. (I) Total organic S [calculated as total-S minus (sulfate plus sulfite)]. Values for (A,B,D–F,H) represent the means of three independent experiments (±SE, n = 3). (C) Represents one of three independent experiments with similar results. Different lowercase letters indicate differences between genotypes within the same treatment. Different uppercase letters indicate significant differences within the plant genotypes in response to treatment (Tukey–Kramer HSD test; JMP 8.0 software).

