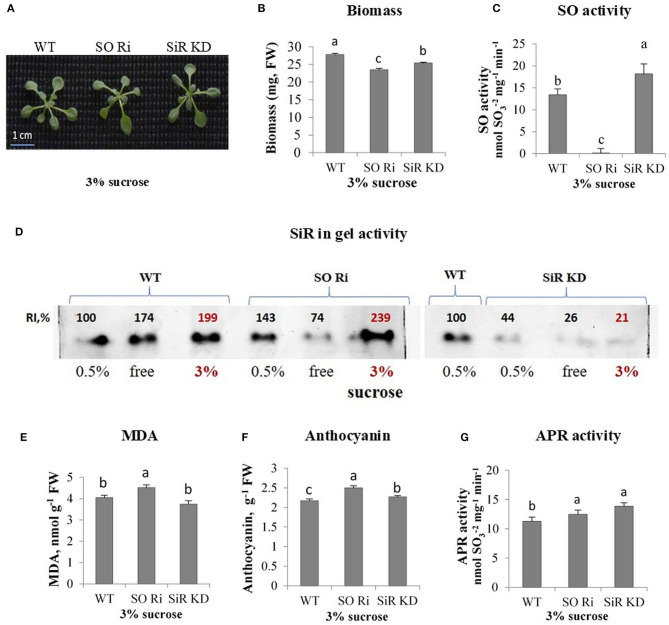
Figure 4.
Characterization of Arabidopsis wild-type (WT) and sulfite reductase (SiR KD), sulfite oxidase (SO Ri) modified plants in response to excess (3% sucrose) carbon in the growth medium. (A) Plants appearance, photographed 9 d after transfer, of 8-day-old seedlings, to agar plates containing 0.5 MS with or without sucrose. (B) Total biomass accumulation of the upper plants part. Values are means (n = 20 plants). (C) SO activity assayed as sulfite disappearance. (D) SiR in-gel activity indicated by the appearance of sulfide, the final product of SiR activity, reacting with lead acetate to generate the brown precipitated activity band of lead sulfide. Crude extracts of carbon treated plants (as 3% sucrose, bolded red font is used to emphasize those points) were subjected to electrophoretic gel fractionation under native conditions. The two separated gels with three (0.5%, free, and 3% sucrose) were assayed together simultaneously. Since the 3% sucrose-treated WT was with ca. 2-fold higher intensity than 0.5% treated WT as the control, and the 3% sucrose treated SiR KD was more than 4-fold lower than the 0.5% sucrose treated WT as the control of the right INSERTED gel, then SiR KD treated with 3% was significantly lower as compared with WT and SO RI treated with 3% sucrose in the left inserted gel. (E) Malondialdehyde (MDA) level. (F) Anthocyanin level. (G) APR activity rate. Values in (C–G) represent one of three independent experiments with similar results (±SE, n = 3). Different lowercase letters indicate differences between genotypes within a treatment (Tukey–Kramer HSD test; JMP 8.0 software).

