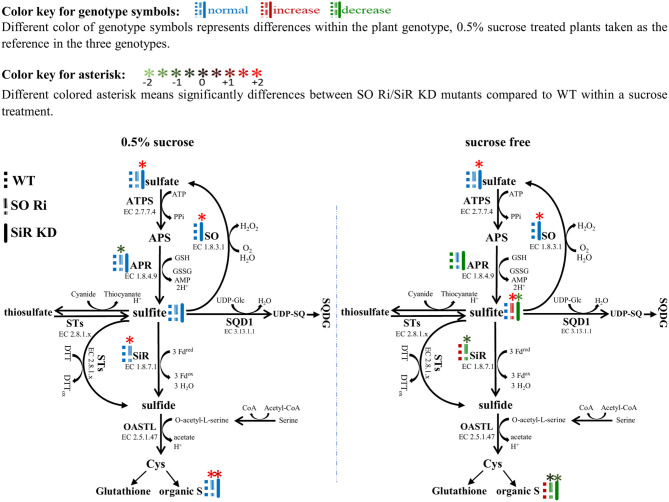
Figure 6.
Schematic illustration depicting the impact of sulfite oxidase (SO) and sulfite reductase (SiR) impairment on the sulfur metabolism in Arabidopsis plants grown under normal (0.5% sucrose) and sucrose starvation (sucrose free) conditions. Genotype symbols with different colors represent differences within the plant genotype; 0.5% sucrose-treated plants are taken as the reference in the three genotypes (see above color key). All of the presented significant differences are based on statistical analyses shown in Figure 3. The organic S was calculated as the difference between total S to the inorganic S (sulfate + sulfite). ATPS, adenosine phosphate sulfurylase; APS, adenosine-5′-phosphosulfate; APR, APS reductase; SiR, sulfite reductase; SO, sulfite oxidase; STs, sulfur transferases; SQD1, UDP-sulfoquinovose synthase1; UDP-SQ, UDP-sulfoquinovose; SQDG, sulfolipid 6-sulfo-α-d-quinovosyl diacylglycerol; OAS-TL, O-acetyl-serine-thiol-lyase; Cys, cysteine; GSH, reduced glutathione; Fdox, Oxidized ferredoxin; Fdred, reduced ferredoxin; H2O2, hydrogen peroxide; PPi, diphosphate; DTT, dithiothreitol; DTTox, Oxidized dithiothreitol.

