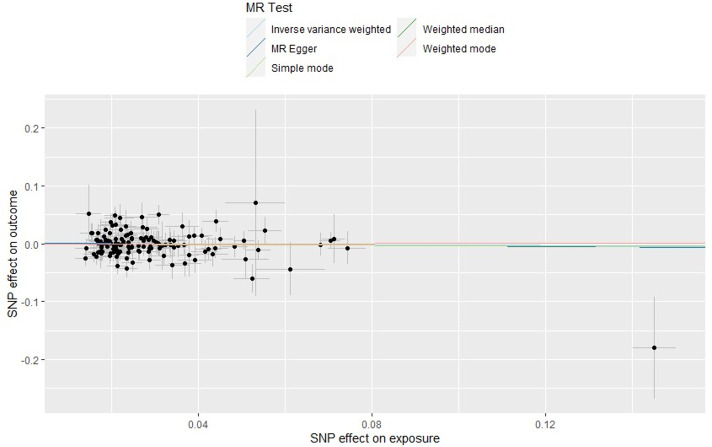
Figure 1.
Scatter plot of the single nucleotide polymorphism (SNP) effect on lung function trait and SNP effect on Alzheimer’s disease. Each point on the graph represents the SNP-outcome association plotted against the SNP-exposure association. Bars indicate 95% CIs. Coloured lines represent analysis method used. This shows no effect of lung function on Alzheimer’s disease. Mendelian randomisation (MR) Egger intercept is close to zero indicating no unbalanced directional pleiotropy.

