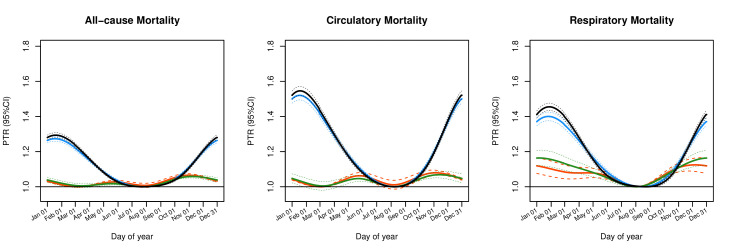
Figure 1.
Pooled seasonality of all-cause, circulatory and respiratory mortality between 1999 and 2015 before and after adjustments (black: without any adjustment; blue: adjusted for influenza-like illness (ILI) only; green: adjusted for temperature only; red: adjusted for both temperature and ILI). PTR, peak-to-trough ratio.

