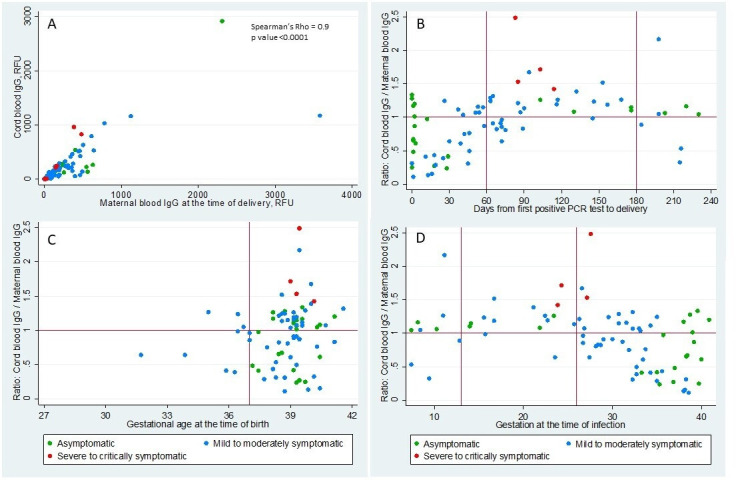
Figure 3.

Correlation of cord blood and maternal IgG and distribution of IgG transplacental transfer ratio. (A) Scatterplot shows the correlation of cord blood SARS-CoV-2 IgG levels in y-axis and maternal blood SARS-CoV-2 IgG levels in x-axis in relative fluorescent unit (RFU). (B) Scatterplot shows the distribution of IgG transplacental ratio (cord blood/maternal blood SARS-CoV-2 IgG levels) in the y-axis and days from maternal first positive SARS-CoV-2 PCR test to delivery in x-axis. (C) Scatterplot shows the distribution of IgG transplacental ratio in the y-axis and gestational age at the time of delivery in x-axis. (D) Scatterplot shows the distribution of IgG transplacental ratio in the y-axis and gestational age at the time of maternal first positive SARS-CoV-2 PCR test in x-axis. The different colours represent the severity of the maternal symptoms at the time of diagnosis.
