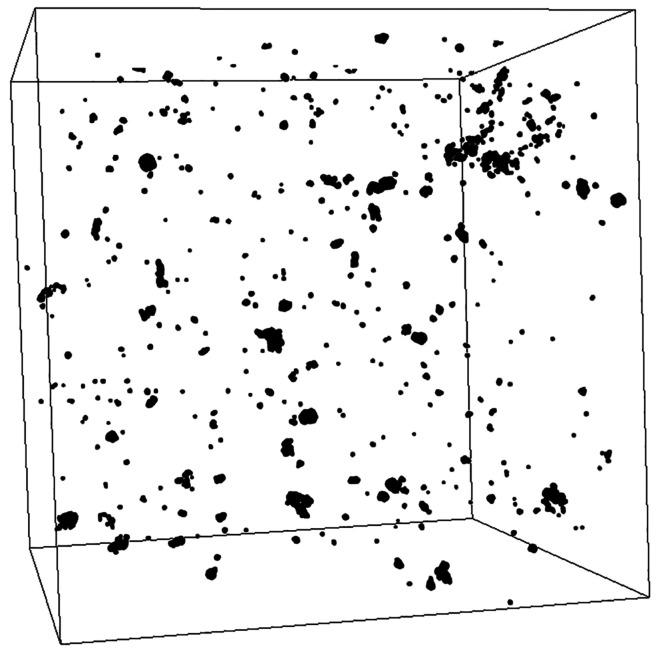
Figure 4.
Partial section of a scan of a bitumen column, showing the spatial distribution of water droplets (black) in the bitumen (white). The cube’s edge length is 10 mm. The largest depicted droplet here has a volume of 54 nL. The image was created with Fiji using a data set from a single CT scan.

