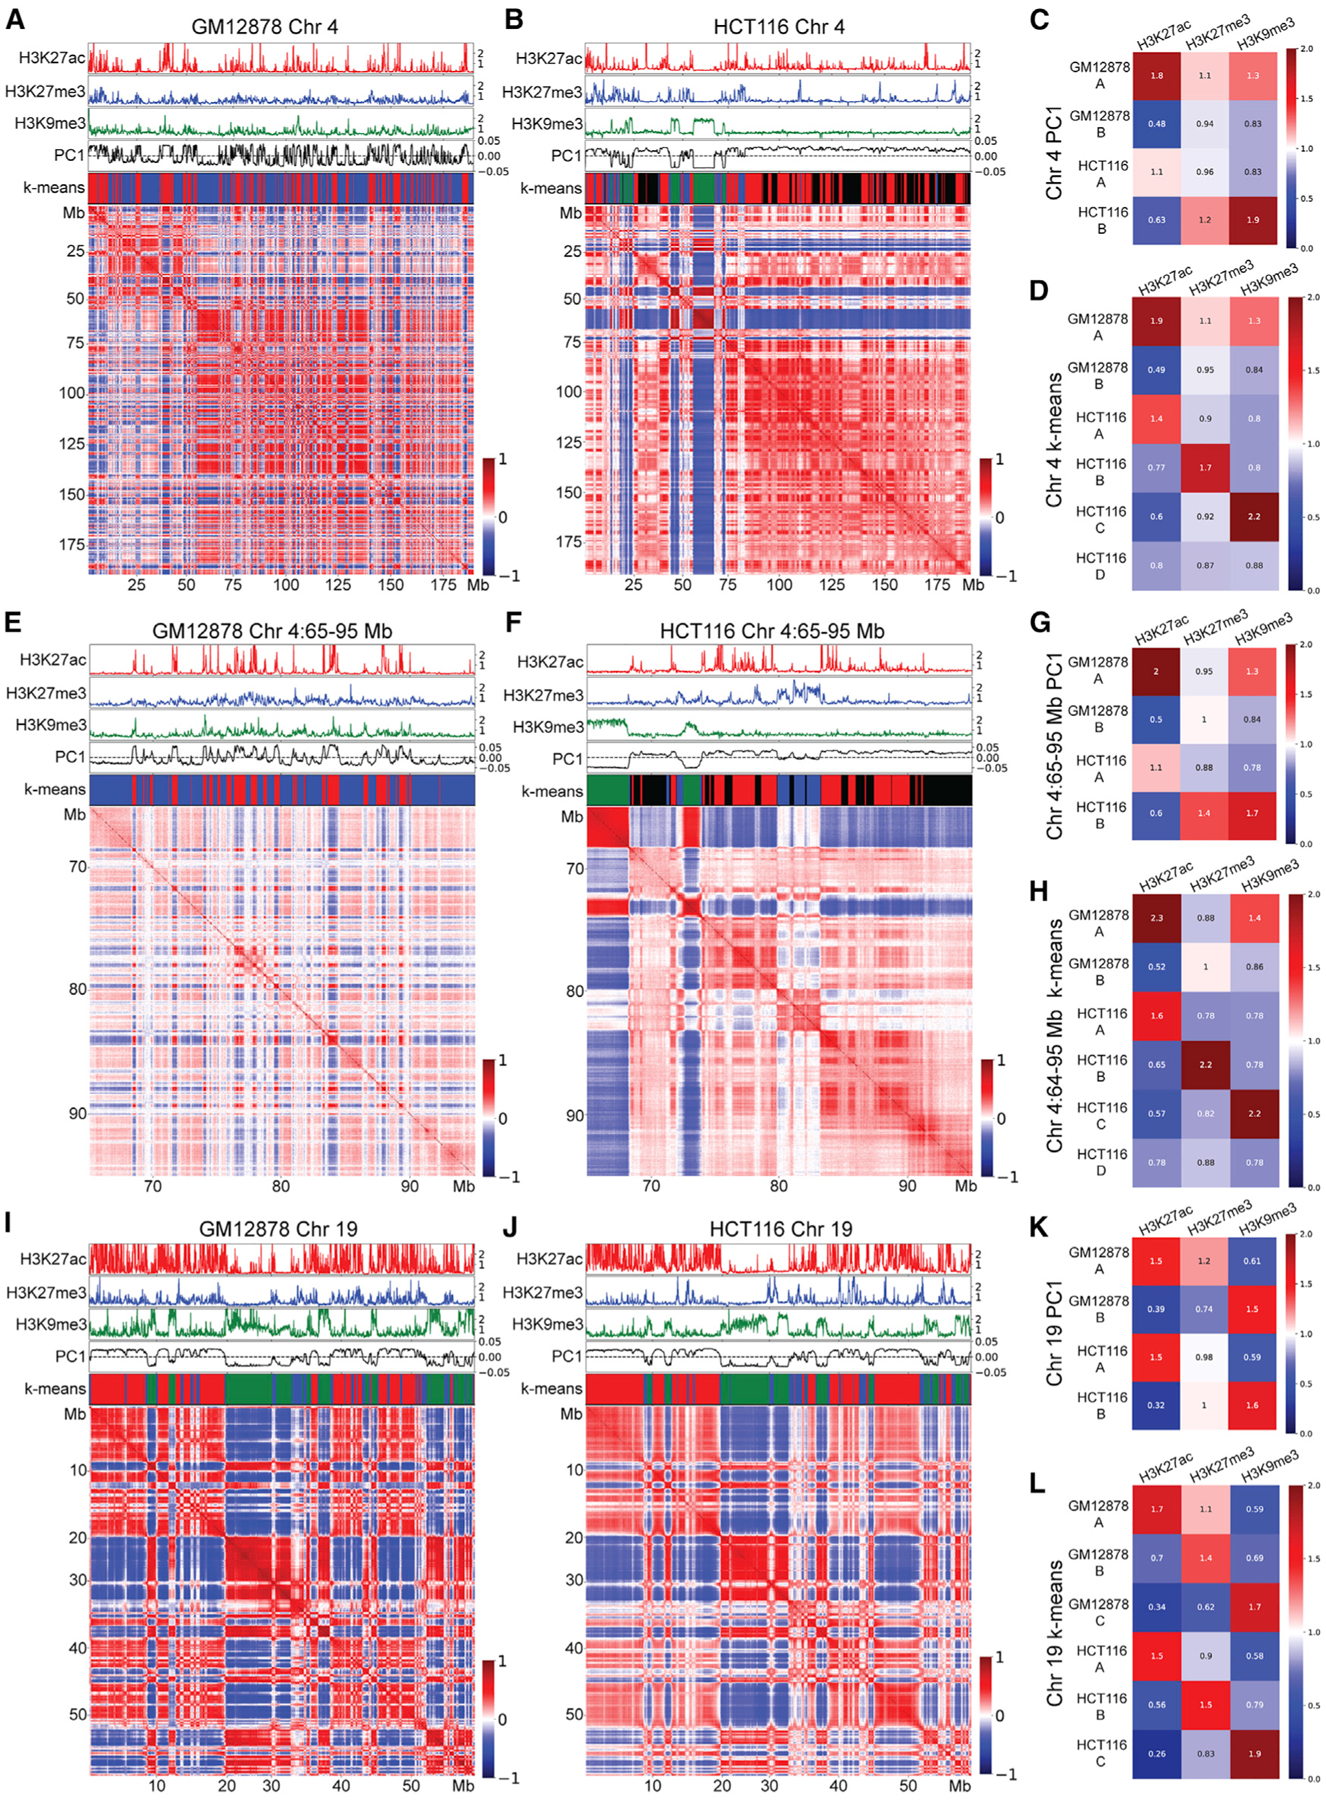
Figure 1. GM12878 and HCT-116 cells show different compartmental patterns.

Pearson correlations of distance-normalized Hi-C interaction frequency maps corresponding to various chromosome regions in GM12878 and HCT-116 cells. On top of each Hi-C map from top to bottom: fold change over control shown for H3K27ac (red), H3K27me3 (blue), and H3K9me3 (green); PC1 component from PCA (black), and k-means cluster classifications corresponding to compartments A (red), B (blue), C (green), and D (black).
(A) Chromosome 4 from GM12878 cells.
(B) Chromosome 4 from HCT-116 cells.
(C) Fold enrichment of each histone modification within each compartment defined by PCA in chromosome 4 from GM12878 and HCT-116 cells.
(D) Fold-enrichment of each histone modification within each compartment defined by k-means clustering on chromosome 4 from GM12878 and HCT-116 cells.
(E) Region spanning 65–95 Mb of chromosome 4 from GM12878 cells.
(F) Region spanning 65–95 Mb of chromosome 4 from HCT-116 cells.
(G) Fold enrichment of each histone modification within each compartment defined by PCA on the region spanning 65–95 Mb of chromosome 4 from GM12878 and HCT-116 cells.
(H) Fold enrichment of each histone modification within each compartment defined by k-means clustering on the region spanning 65–95 Mb of chromosome 4 from GM12878 and HCT-116 cells.
(I) Chromosome 19 from GM12878 cells.
(J) Chromosome 19 from HCT-116 cells.
(K) Fold enrichment of each histone modification within each compartment defined by PCA on chromosome 19 from GM12878 and HCT-116 cells.
(L) Fold enrichment of each histone modification within each compartment defined by k-means clustering on chromosome 19 from GM12878 and HCT-116 cells.
