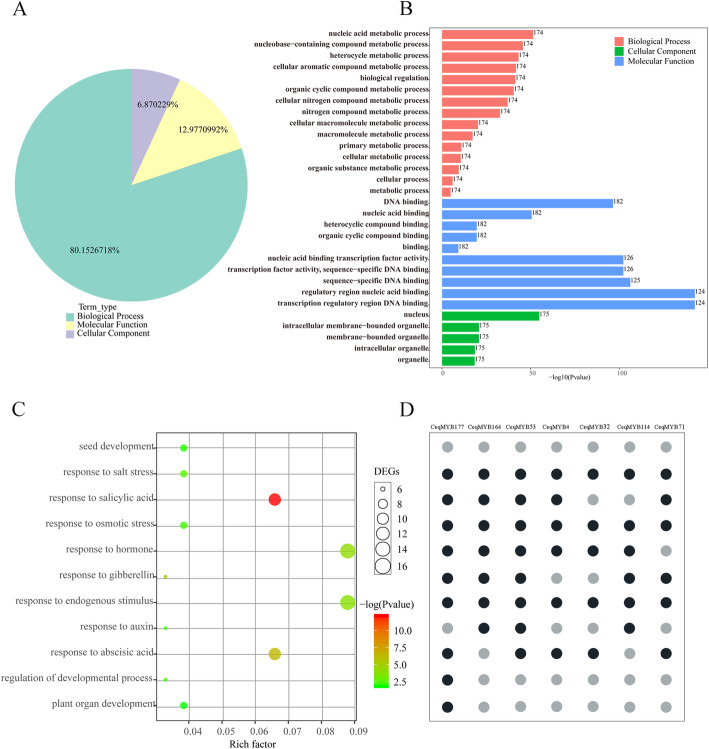
Fig. 8.
GO enrichment analysis of 182 CeqMYB genes under salt stress. A the GO annotation using a cut-off value of P ≤ 0.05 showed that a total of 131 GO items, including molecular function, biological process, and cellular component. B The numbers of predominant GO items. C Some CeqMYB genes assigned to the categories associated with development, hormone, and stress response. The color gradient represents the size of the P value and the size of circular represents number of CeqMYB genes. The “rich factor” shows the ratio of the number of the CeqMYB genes to the total gene number in certain categories D Seven genes were assigned to the “response to salt stress” category. The grey circular indicated the gene was not involved in the category. The black circular indicated the gene was assigned to relevant category

