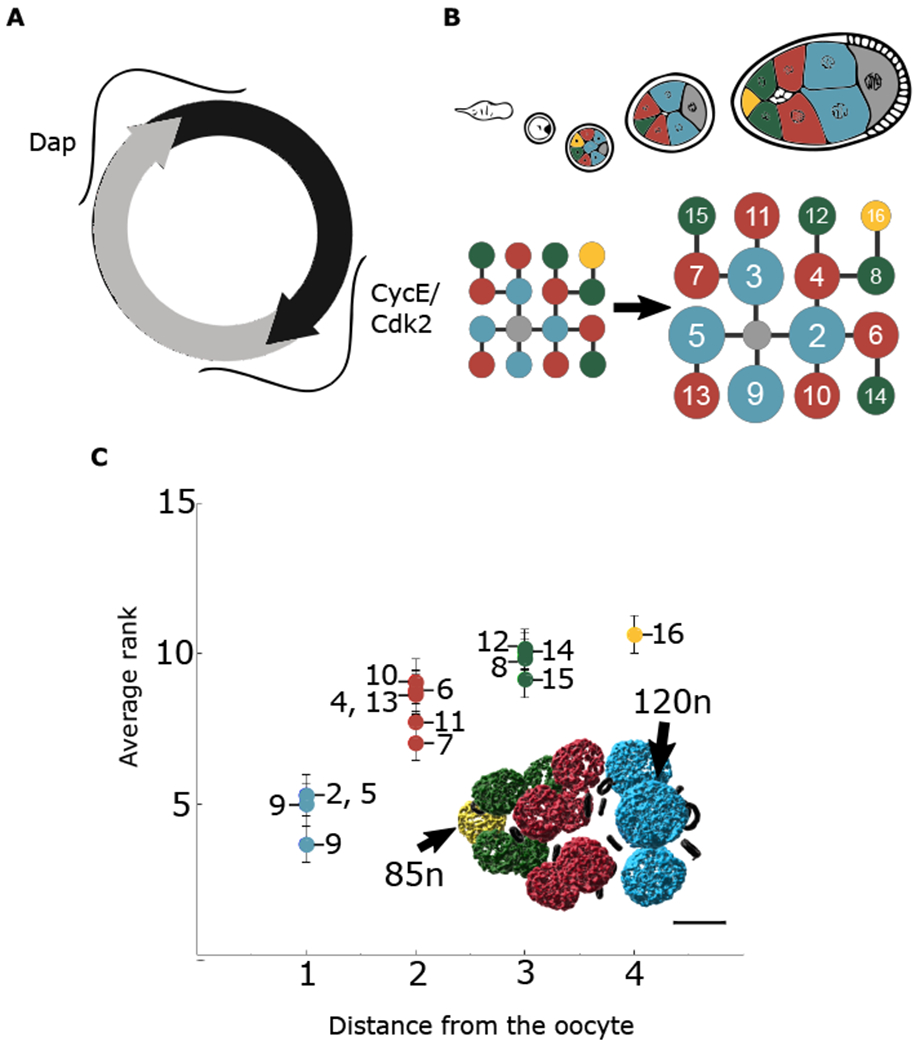
Figure 1. Groups identified in volume hierarchy are also observed in DNA content hierarchy.

(A) Schematic of CycE/Cdk2 and Dap during NC endocycles.
(B) Representation of NC groups based on proximity to the oocyte. Blue cells are directly connected to the oocyte and have the largest volume on average. Red cells are two ring canal connections away and next largest on average. Green cells are three ring canal connections away and third largest on average. The single yellow cell is four ring canal connections away and smallest on average. Numbering is assigned based on the initial pattern of four incomplete mitotic divisions that give rise to the cyst. Each NC is uniquely identifiable within the lineage tree.
(C) Averaged ranking of DNA content (highest = rank 1, lowest = rank 15) from stages 2–9; n = 33 egg chambers. The same groups emerge as with volume measurements. Reconstruction of DAPI signal reveals hierarchy of DNA content within an egg chamber. Error bars represent standard error. Scale bar, 20 μm
