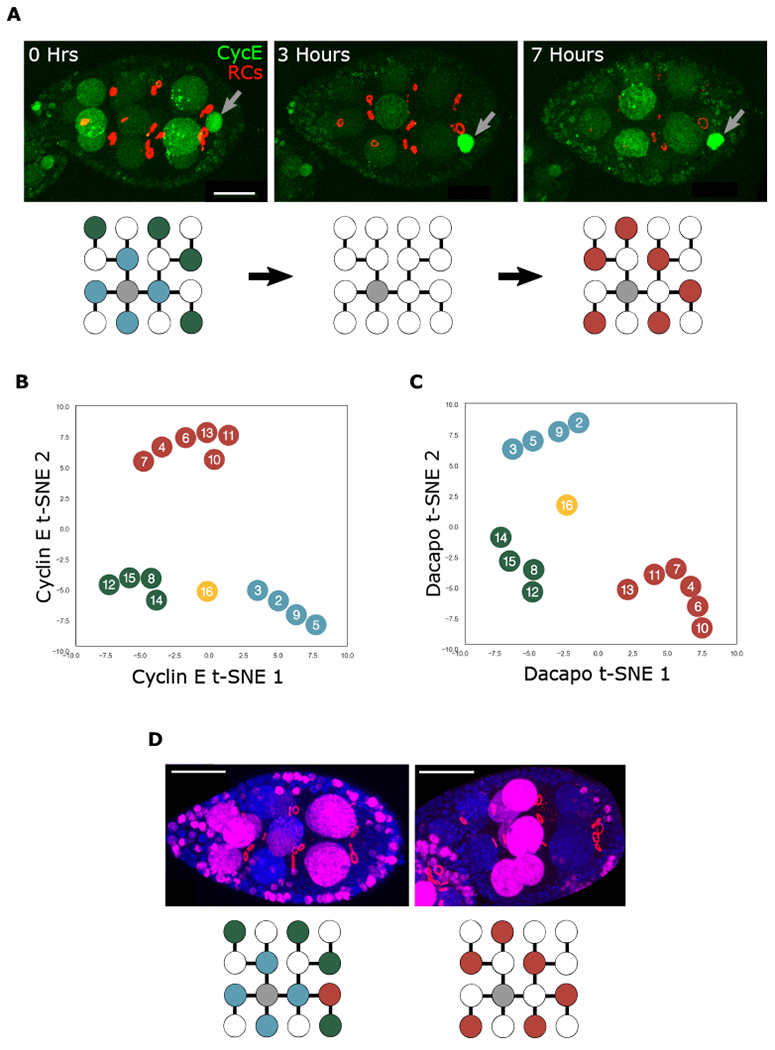
Figure 2. Groups identified in volume hierarchy are also observed in endocycle progression.

(A) Snapshots of a CycE-sfGFP (CycE) egg cultured ex vivo for 7 h. Ring canals (RCs) are marked with Pavarotti-mCherry. The red channel was generated from reconstruction of RCs. The signal from follicle cell RCs was removed for clarity. High levels of CycE are detected in the oocyte nucleus (gray arrows). Below is a visual representation of NC groups, with high levels of nuclear CycE indicated with colored circles and low levels with white circles.
(B and C) t-SNE representation of CycE (B) and Dap (C) NC nuclear localization patterns from stages 2–9; n = 52 egg chambers (B), n = 80 egg chambers (C).
(D) Egg chambers cultured ex vivo in EdU for 1 h (magenta). RCs are marked with phosphotyrosine antibody (red). DNA is stained with DAPI. NC nuclei with incorporation are marked below. Scale bars, 20 μm.
