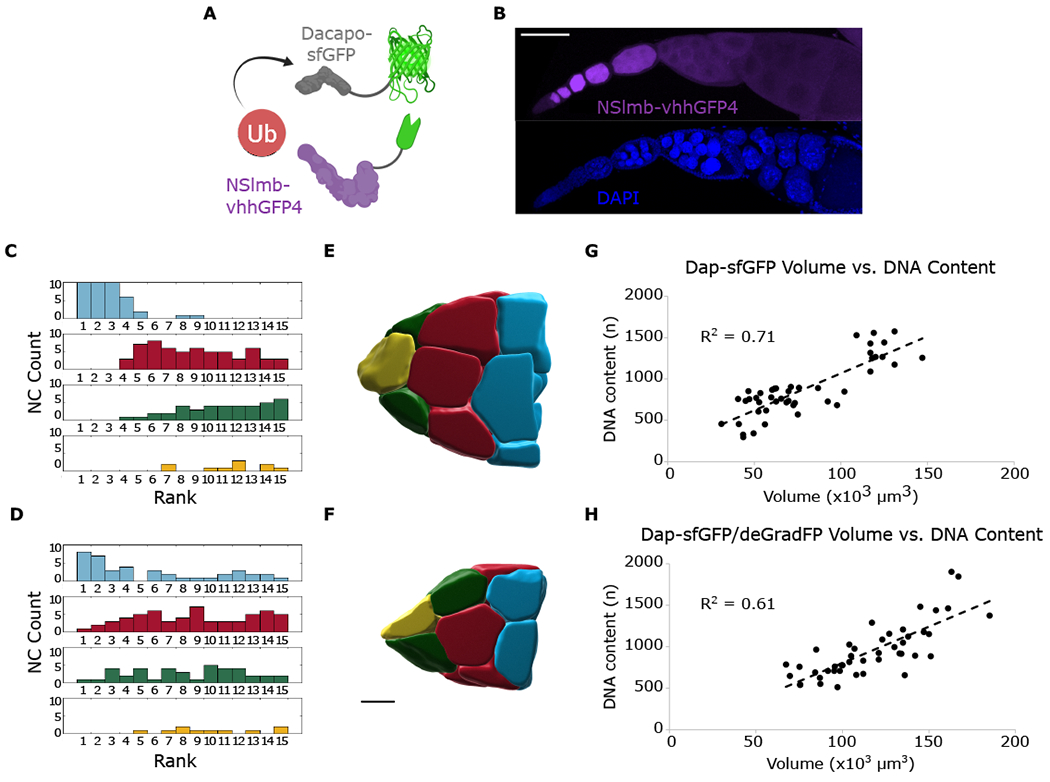
Figure 6. Post-translational degradation of Dap disrupts cyst volume hierarchy.

(A) Schematic showing ubiquitination of Dap-sfGFP targeted by interaction with deGradFP.
(B) Confocal z series projection of deGradFP (purple) and DAPI (blue) localization. Localization of deGradFP is uniform within cysts after oocyte specification and tapers off at later stages.
(C and D) Group histograms of ranked volumes for Dap-sfGFP (C) and Dap-sfGFP; deGradFP (D). Brown-Forsythe test for equality of variances for blue group, p = 5.6 × 10−06, indicating difference in variance is statistically significant.
(E) Reconstruction of Dap-sfGFP NCs. Size hierarchy is observed.
(F) Reconstruction of Dap-sfGFP; deGradFP NCs. Size hierarchy is disrupted.
(G and H) Quantification of NC volume and DNA content from stage 9 egg chambers for Dap-sfGFP (G) and Dap-sfGFP; deGradFP (H); n = 3 for each condition. Scale bars, 100 μm (B), 40 μm (E) and (F).
