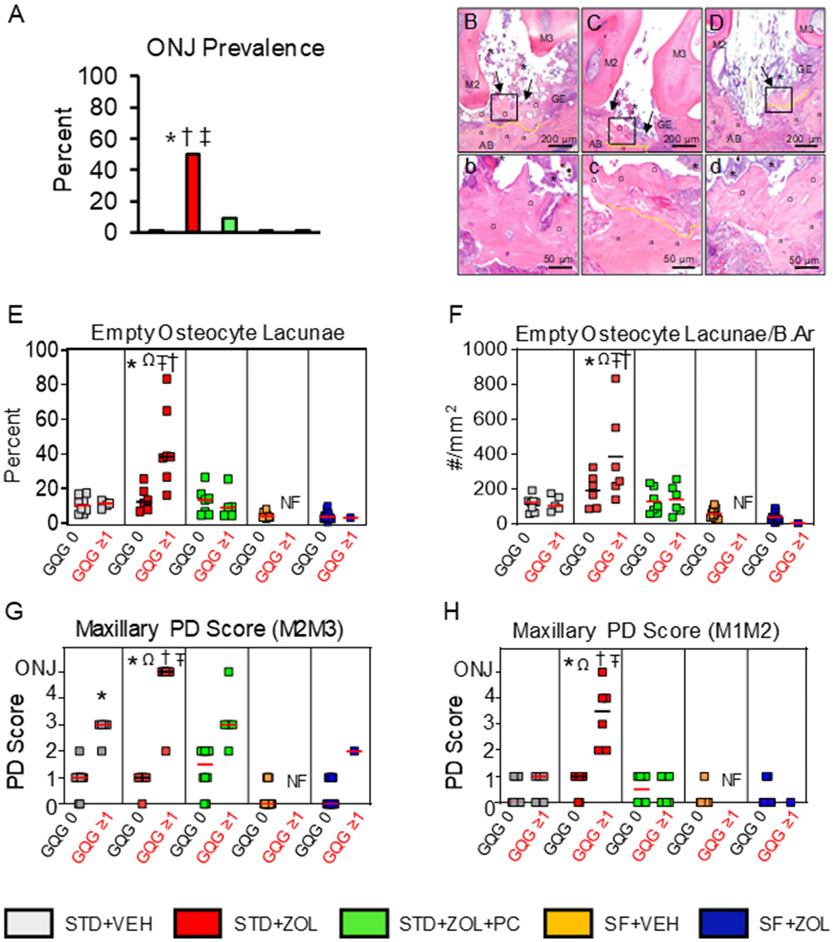
Fig. 2. Histopathologic assessment of necrotic exposed bone and other features.
A. STD + ZOL rats had greater prevalence of ONJ compared to STD + VEH (*p = 0.02), STD + ZOL + PC (†p = 0.012) and both SF groups (‡p < 0.001). 50% of STD + ZOL rats developed ONJ compared to 7% and 0% of STD + ZOL + PC and STD + VEH rats, respectively. Both SF + VEH and SF + ZOL groups had 0% prevalence of ONJ. B–D. Photomicrographs showing features of ONJ found in the STD + ZOL group. b–d depict areas outlined in black in B–D, at a four-fold higher magnification. Maxillary oral lesions are shown at the M2M3 interdental space, in proximity to the palatal (B–C) and buccal (D) surfaces of STD + ZOL rats with ONJ. Ulcerated gingival epithelium (GE) accompanied by adherent bacterial colonies (*) and exposed, necrotic bone (black arrows) is present at the M2M3 interdental space. b–d. Exposed necrotic bone (Ω) with 10+ confluent empty osteocyte lacunae or osteocytes with pyknotic nuclei is seen next to vital bone (α) which has lacunae occupied by osteocytes with basophilic nuclei (demarcated in yellow). Severe inflammatory cell infiltration and fibrosis was often observed. E. The percentage of empty osteocyte lacunae was significantly greater in STD + ZOL rats with GQG≥1 lesions compared to the STD + ZOL subgroup with GQG = 0 lesions (Ωp < 0.001). STD + ZOL rats with GQG≥1 also had greater percentage of empty osteocyte lacunae compared to STD + VEH (*p = 0.001), STD + ZOL + PC (†p = 0.002), and both SF groups (‡p < 0.05). There are no significant differences in percentage of empty osteocyte lacunae among STD + VEH, STD + ZOL + PC, SF + VEH, and SF + ZOL. F. The number of empty osteocyte lacunae/bone area (B.Ar, mm2) was higher in STD + ZOL rats with GQG≥1 compared to STD + ZOL rats with GQG = 0 (Ωp = 0.005). STD + ZOL rats with GQG≥1 also had a greater number of empty osteocyte lacunae/bone area compared to STD + VEH (*p = 0.001) and STD + ZOL + PC rats with GQG≥1 (†p = 0.001) as well as SF + VEH and SF + ZOL rats with GQG = 0 (‡p < 0.05). G. Maxillary PD Score at the M2M3 interdental space. PD Scores ranged from gingivitis (PD Score 1) to mild periodontitis (PD Score 2) in the STD diet group subsets with GQG = 0. STD + VEH rats with GQG≥1 had mild to moderate periodontitis (PD Score 2–3) with a median score of 3. STD + ZOL rats had greater prevalence of periodontitis lesions compared to STD + VEH (*p = 0.002) and STD + ZOL + PC (†p = 0.005) rats with GQG = 0. STD + ZOL rats also had greater prevalence of periodontitis than SF + ZOL rats (‡p < 0.05). STD + VEH rats with GQG≥1 had greater prevalence of PD lesions compared to STD + VEH rats with GQG = 0 (*p > 0.05). Two-way ANOVA showed an effect in diet in which SF rats had less severe periodontitis lesions compared to STD rats (*p < 0.05). H. Maxillary PD Score at the M1M2 interdental space. There was a significantly higher prevalence and severity of periodontitis lesions in STD + ZOL rats with GQG≥1 compared to STD + ZOL rats with GQG = 0 (Ωp < 0.005). STD + ZOL also had a higher prevalence and severity of periodontitis lesions compared to STD + VEH (*p = 0.006), STD + ZOL + PC (†P = 0.006), SF + VEH (Ŧp = 0.017), and SF + ZOL (‡p = 0.016). Red or black transverse lines in each group of the graphs depict median values.

