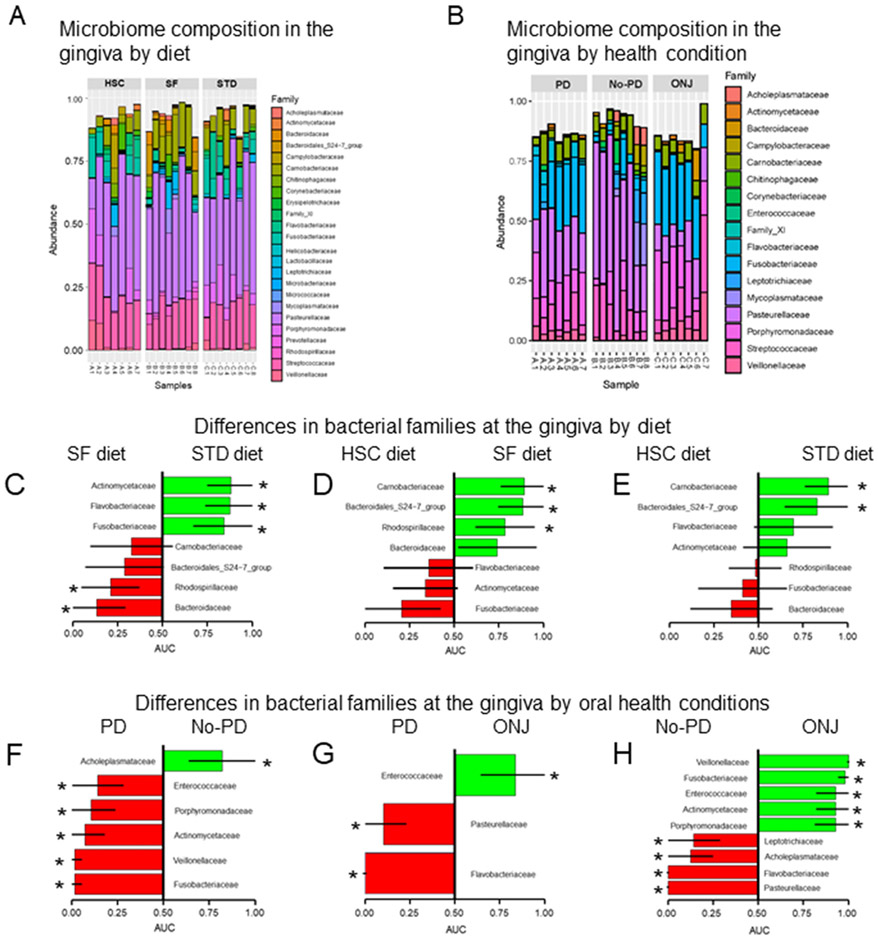
Fig. 4. Oral microbiome composition and differences in bacterial families by diet and oral health condition after 24 wks of treatments.
Bar plots summarizing (A) the gingiva microbiome composition by diet; high sucrose and casein (HSC), high soluble fiber (SF) and standard diet (STD) and (B) the gingiva microbiome composition at family levels by oral health condition; maxillary localized periodontitis (PD), No-PD (healthy) and ONJ. Differences in bacterial families at the gingiva between: (C) rats fed the SF diet compared to rats fed the STD diet; (D) rats fed the HSC diet compared to rats fed the SF diet; and (E) rats fed the HSC diet compared to rats fed the STD diet. Differences in bacterial families at the gingiva between quadrants with: (F) PD and No-PD lesions; (G) PD and ONJ; and (H) No-PD and ONJ. AUC: area under the curve. Asterisk (*) depict significant differences (Kruskal-Wallis, p < 0.05).

