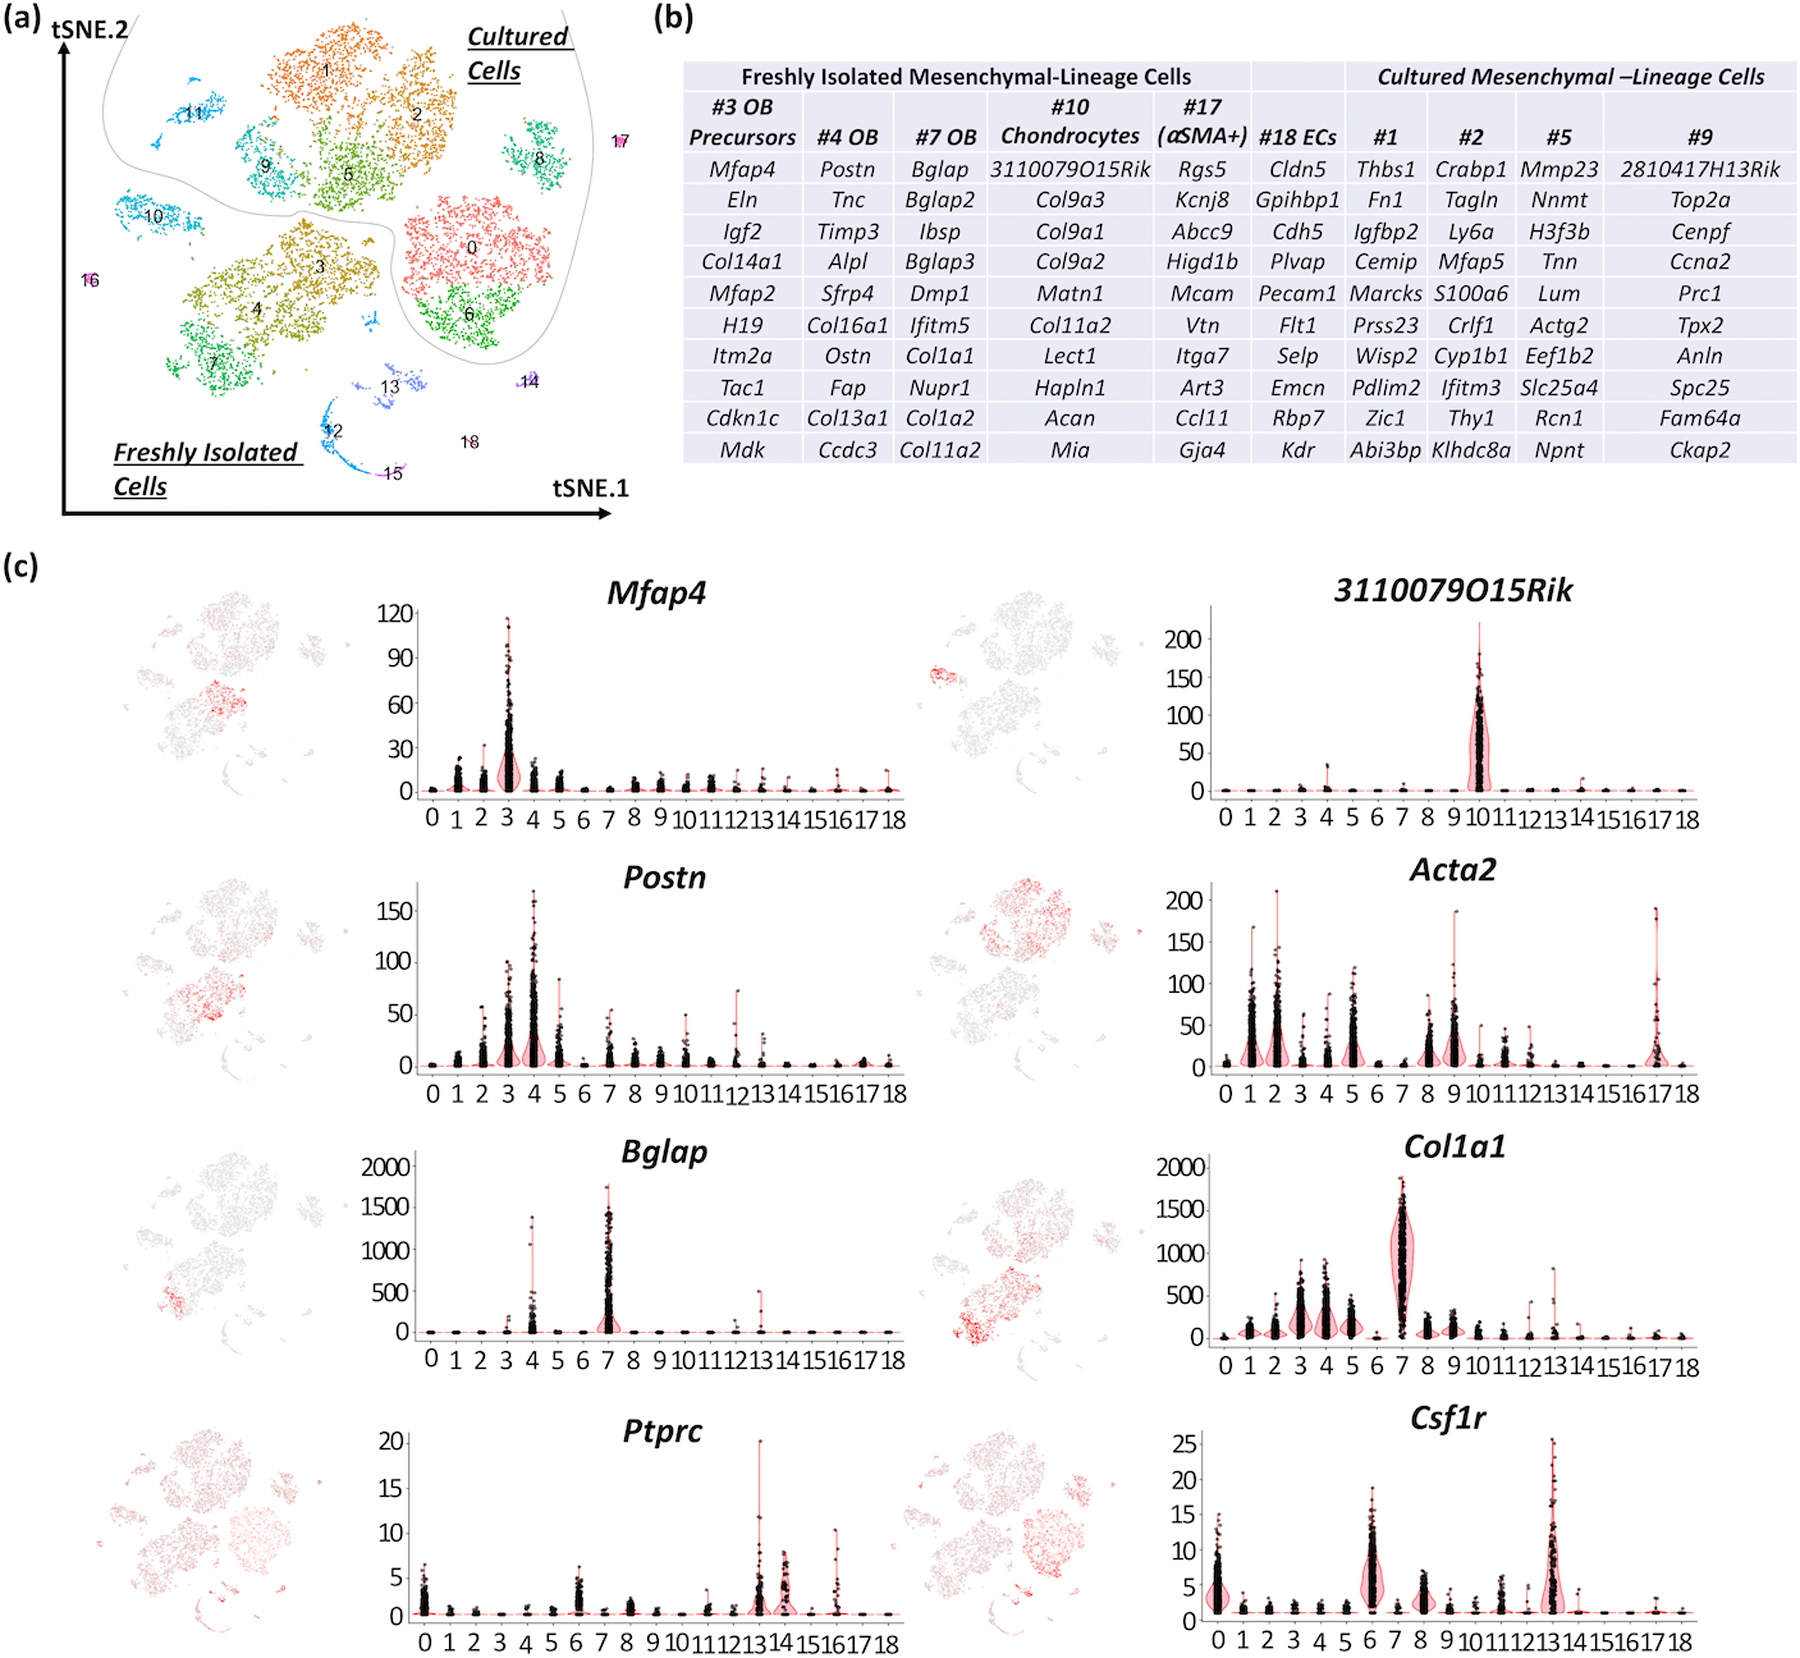
Figure 2: Cell clusters identified among cultured and fresh calvarial cells.

(a) tSNE plot wherein each dot represents a single cell, and cells sharing the same color code indicate discrete populations of transcriptionally similar cells. Cultured and freshly isolated cells form separate clusters (dashed line). Of note, cells in cluster #8 express transcripts associated with mesenchymal (e.g. Col1a1, Acta2) and hematopoietic (Ptprc and Csf1r) lineages, have higher than expected UMI counts, and likely represent artifact due to 2 cell types being captured in a single droplet. (b) Top 10 transcript markers corresponding to each cell cluster as determined by Seurat (OB: osteoblast). (c) Heatmaps of gene expression (left) and associated violin plots (right) indicate cluster-specific expression of representative genes. Osteoblast-lineage cells among freshly isolated calvarial cells are distinctly marked by the expression of Mfap4 (#3), Postn (#4) and Bglap (#7). Similarly, cultured osteoblast-lineage cells express Acta2 and Col1a1 (#1, 2, 5 and 9), whereas hemaotopoietic cells express Csf1r and Ptprc (#0, 6 and 8).
