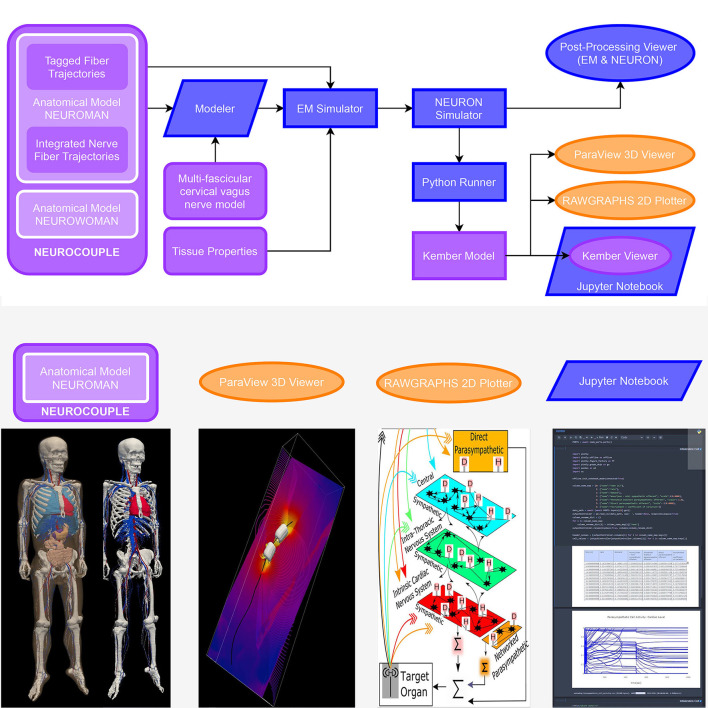
Figure 10.
Biophysical modeling and analysis workflow implemented at the end of the first o2S2PARC development year as a demonstrator of the feasibility of an open, readily extensible, online-based platform for collaborative computational neurosciences. (purple: published on the portal, blue: o2S2PARC services, yellow: 3rd party viewers embedded in o2S2PARC) Electromagnetic exposure of the vagus nerve by a bioelectronic implant is simulated, along with the resulting vagus nerve stimulation and its impact on cardiovascular activity: A “NEUROCOUPLE” service injects the male NEUROMAN anatomical model, along with a multi-fascicular cervical vagus nerve model layer and integrated nerve fiber trajectories, into a “Modeler” service, where interactive constructive geometry is used to integrate an implant electrode geometry. The different NEUROMAN anatomical regions are already tagged with tissue names and the fiber trajectories with electrophysiological information (fiber type and diameter). The implant-enhanced anatomical model serves as input to an “EM Simulator” service, which obtains dielectric properties from a “Tissue Properties” service and assigns them to regions based on their tags. After defining boundary conditions, discretization, and solver parameters, the high-performance computing enabled electro-quasistatic solver is called. The resulting electric potential is injected into a “NEURON Simulator” service, which also receives the tagged fiber trajectories from the “NEUROCOUPLE” service as input and discretizes these trajectories into compartment with associated ion channel distributions (according to predefined, diameter-parameterized fiber models), produces input files for the neuronal dynamics simulator from NEURON, and executes the simulations using NEURON's “extracellular potential” mechanism to consider the electric field exposure. A “Python Runner” service implements the computation of stimulation selectivity indices, which feed a “Kember Model” service that contains an implementation of the multi-scale cardiac regulation model from Kember et al. (2017). A “Paraview 3D Viewer” service and a “Rawgraphs Viewer” service provide result visualization. Finally, a “Kember Viewer” service performs predefined post-processing analysis on the output of the “Kember Model” service and visualizes the results. The “Kember Viewer” service is a specialized instance of the “Jupyter Notebook” service, which permits to present a (Python) script along with documentation in an interactively explorable and editable form. Selected components of this study (anatomical model, 3D visualization of EM field and neural activity, Kember cardiac regulation model, example JupyterLab service) can be found on https://sparc.science/data?type=simulation.

