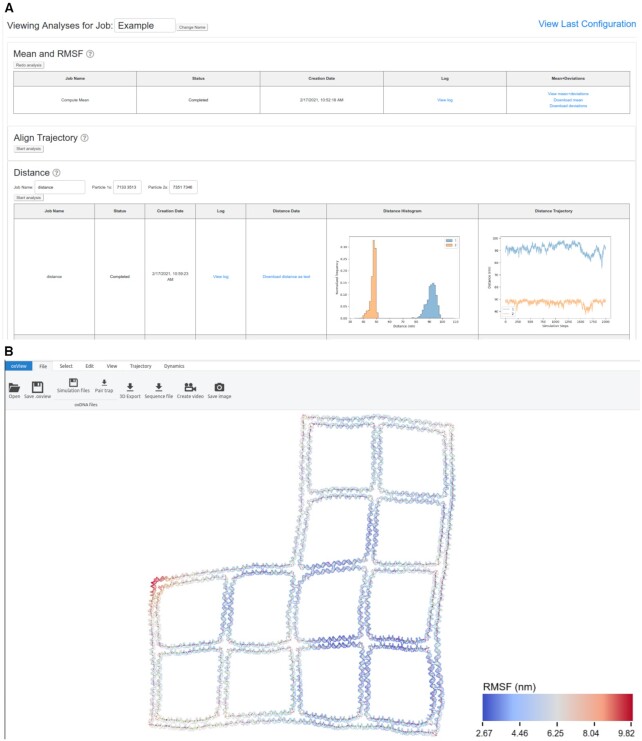
Figure 4.
Analyzing a completed job The job analysis interface showing a few of the options available to users when their simulation finishes. (A) In this example, a wireframe DNA origami from (44) was simulated and, when finished, the mean structure with RMSF and the end-to-end distances of two of the edges were calculated. Clicking on the ‘view’ options will open the structure in a separate oxView tab allowing the user to interactively explore their results (B).

