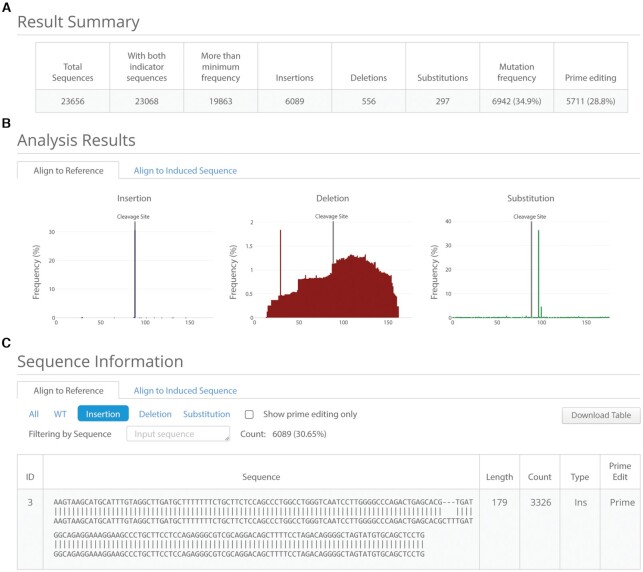
Figure 2.
PE-Analyzer results panel. (A) Summary table indicating the number of sequence reads for each type of mutation. ‘Prime editing’ indicates the count of the desired sequence. (B) Bar graphs showing the distribution of insertions, deletions, and substitutions. The graphs can be changed by clicking the buttons above the graphs to switch the alignment of query sequences against either reference or expected sequences. (C) Table of alignment results. The results can be changed by clicking the buttons to switch the alignment of query sequences against either reference or expected sequences, or to filter the results by the mutation type; specific sequences can be found by entering that information.

