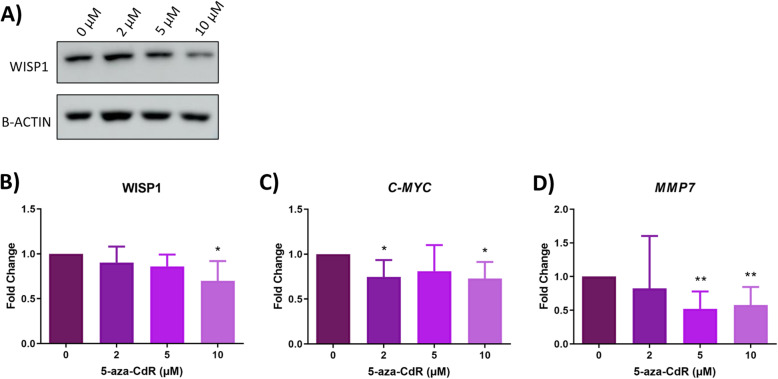
Fig. 4.
Wnt/β-catenin signaling pathway analysis in HULP cells after DNMT inhibition with 5-aza-CdR treatment. A Representative images of protein expression for WISP1 in HULP cells after treatment with 5-aza-CdR at 0, 2, 5, or 10 μM for 72 h. B Normalized quantitative protein expression of WISP1 represented as mean and deviations of fold-change. Gene expression levels of C c-MYC and D MMP7 in HULP cells treated for 72 h with 2, 5, or 10 μM of 5-aza-CdR compared to untreated HULP cells (0 μM), represented as fold-change. * p-value < 0.05 ** p-value < 0.01

