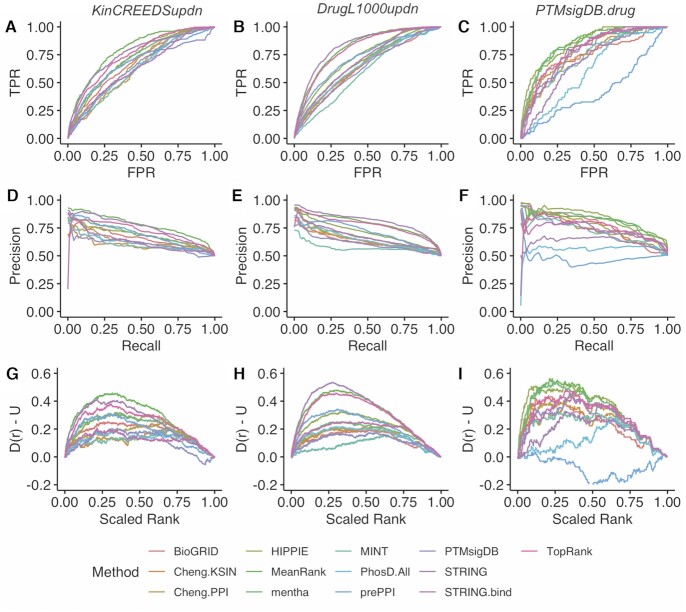
Figure 4.
Performance of the final selected KEA3 libraries and integration methods in recovering the perturbed and drug-targeted kinase(s) from the three benchmarking datasets. (A–C) ROC curves for KinCREEDSupdn, DrugL1000updn, and PTMsigDB.drug, respectively; (D–F) Composite PR curves generated from 5,000 bootstrapped curves for KinCREEDSupdn, DrugL1000updn, and PTMsigDB.drug, respectively; (G–I) The deviation of the cumulative distribution from uniform of the scaled rankings of the ‘true’ kinases for KinCREEDSupdn, DrugL1000updn and PTMsigDB.drug, respectively.

