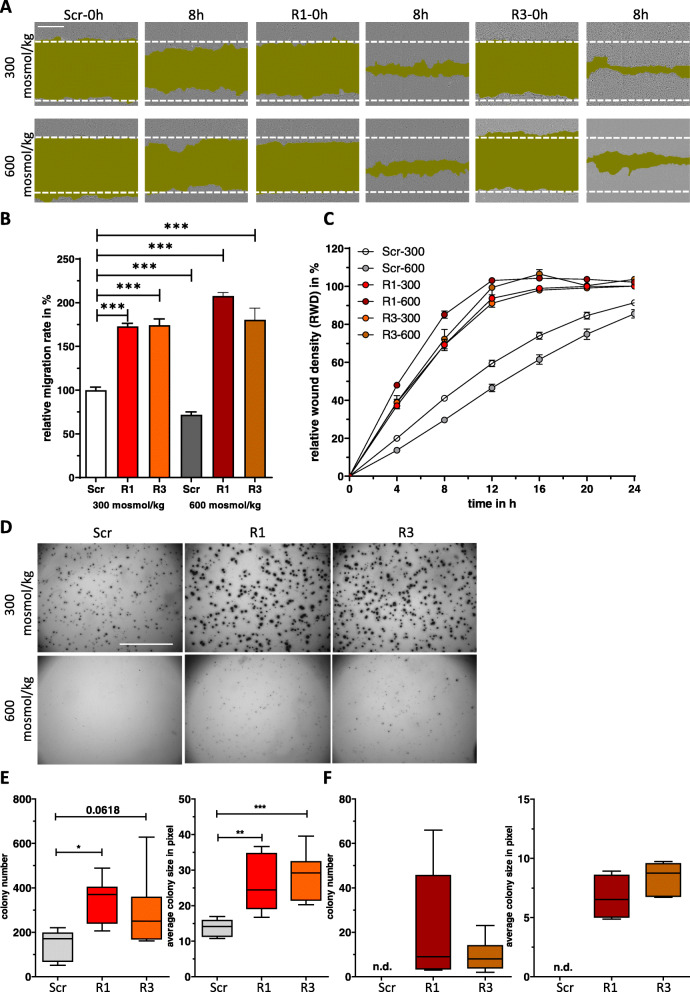
Fig. 3.
RANBP3L deficiency induces cell migration and colony forming capacity. A Representative images of the migration assay. Scr, R1 and R3 mpkCCD cells were cultivated in 96 well plates and cell migration was monitored by live cell imaging using IncuCyte S3 system. The pictures show the progressive closure of an induced wound at indicated time points (0 h and 8 h). Wound areas are labeled in dark green. Scale bar: 400 μm. B Plot of the wound density over time. Migration assay was performed for 24 h. Values represent mean ± SEM (error bars). n = 6 (with 4 technical replicates). C The relative migration change after 8 h was calculated by linear regression analysis using GraphPad Prism. ***, p < 0.001, 1-way ANOVA. D Representative images of Scr, R1 and R3 cells during colony forming assay. After 2 weeks of incubation 4–5 images per well were taken and stacked with the image J software tool. Scale bar: 500 pixels. E-F Colony number and colony size at 300 mosmol/kg (E) and 600 mosmol/kg (F). Values are represented in a whiskers 1–99 percentile plot. n.d. = not detectable, *, p < 0.05, **, p < 0.01, ***, p < 0.001, 1-way ANOVA

