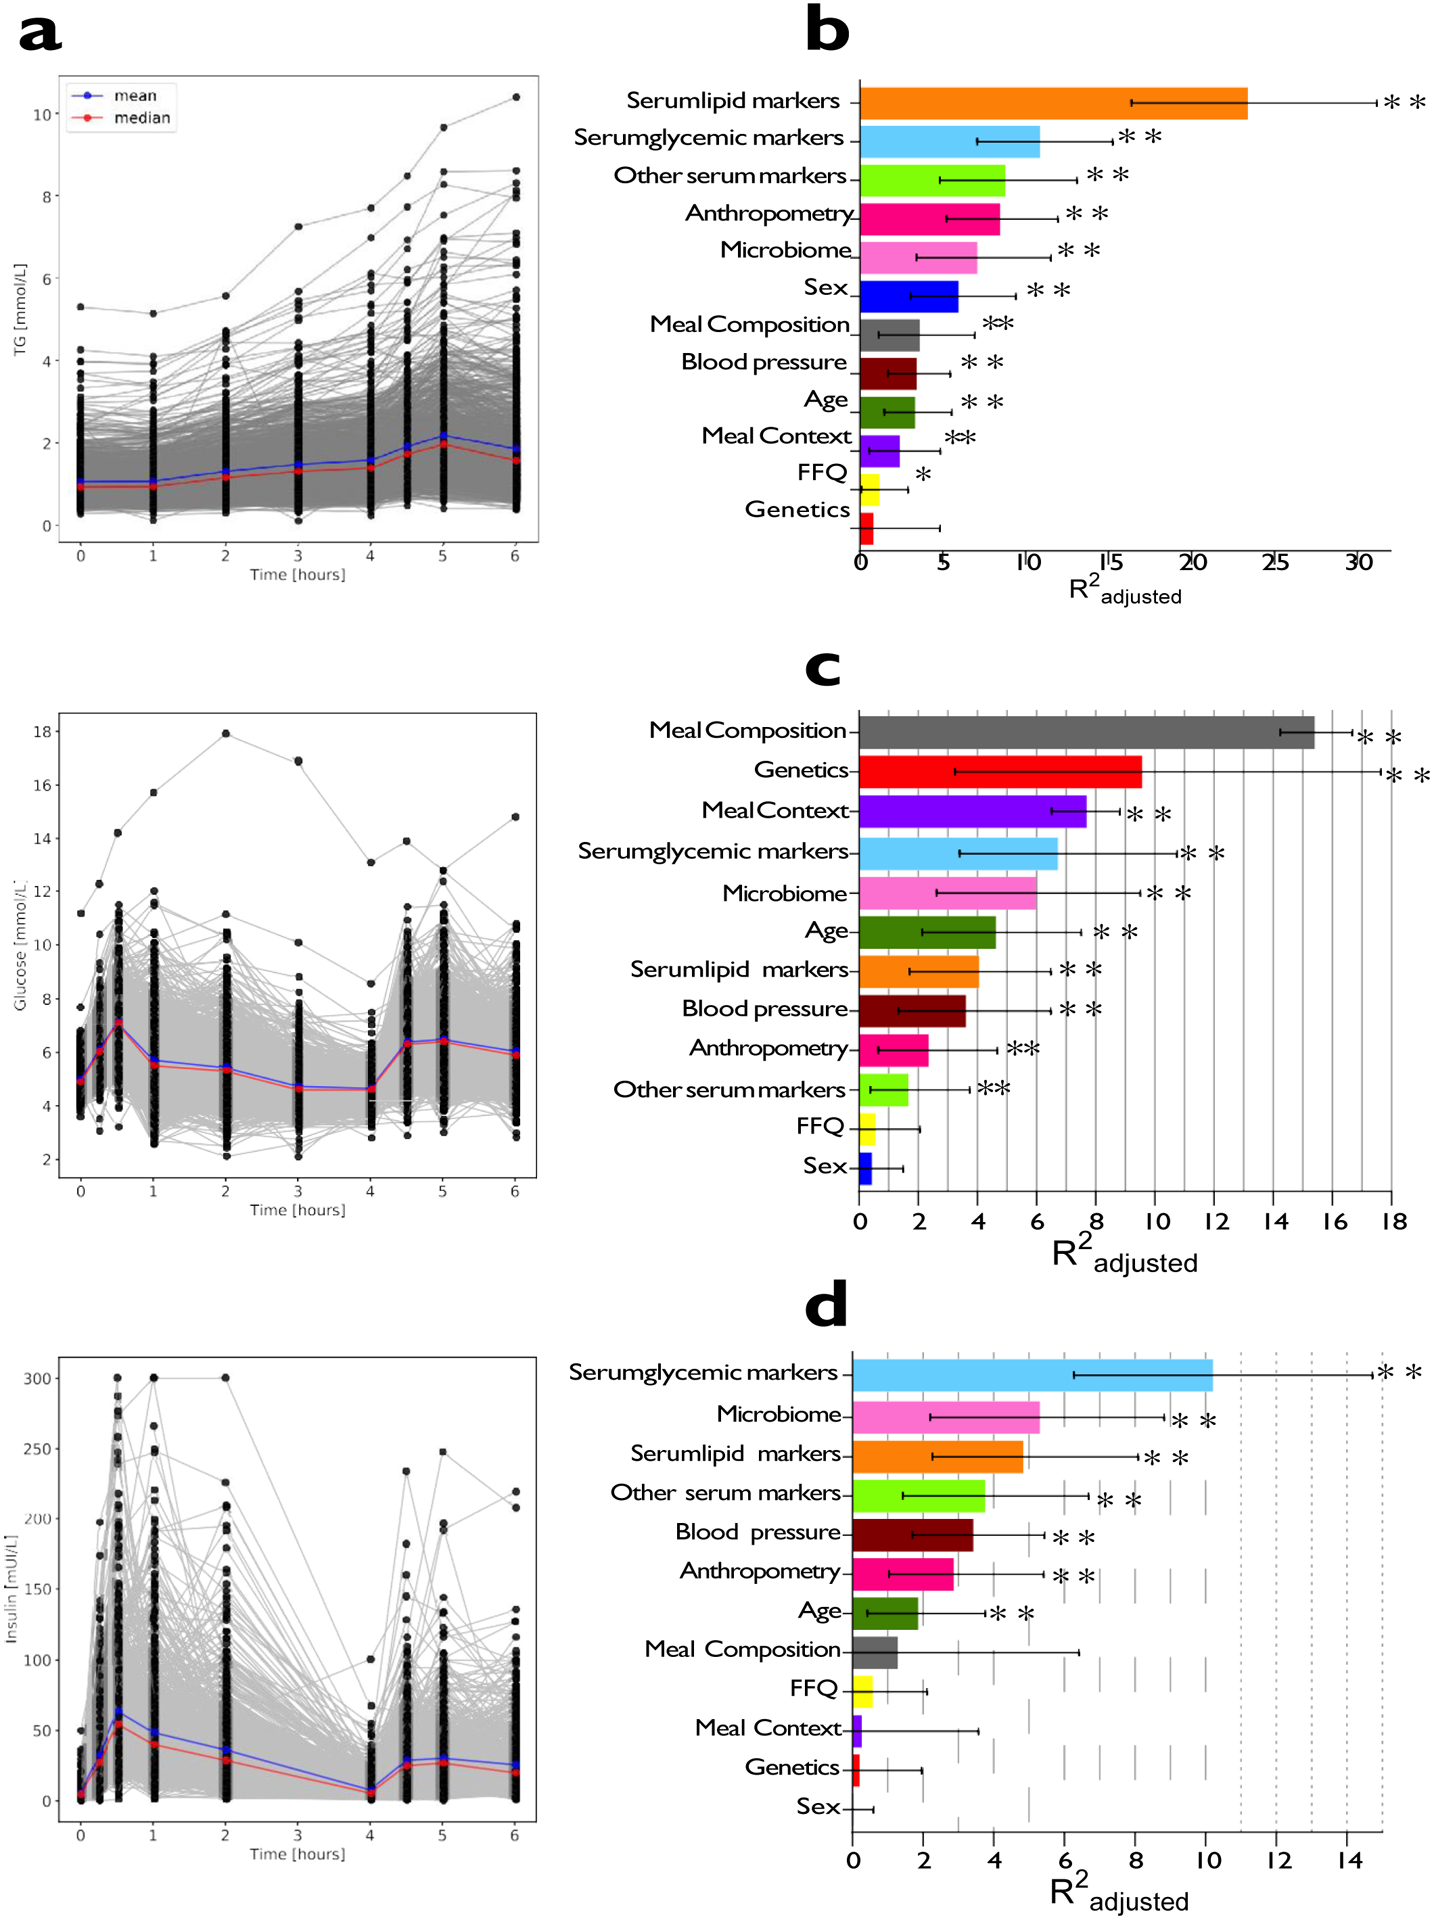
Figure 2. Variation in postprandial responses.

a. Inter-individual variation in triglyceride, glucose and insulin postprandial responses to the breakfast and lunch meal challenges in the clinic (n = 1002). b. Determinants of triglyceride6h-rise measured from DBS (comparison of meals 1 and 7). c. Determinants of glucoseiAUC0-2h measured by CGM (comparison of 7 test meals; 1, 2, 4, 5, 6, 7 and 8). d. Determinants of C-peptide1h-rise measured from DBS as a proxy for insulin (comparison of meals 2 and 3). Trait variations explained for each input variable are derived from separate (non-hierarchical) regression models. Values represent adjusted-R2 and error bars reflect 95% confidence intervals. Meal composition and Meal context adjusted-R2 values were derived from meal sample sizes as follows; triglyceride6h-rise, n = 712; glucoseiAUC0-2h, n = 9102; C-peptide1h-rise, n = 186. All other determinant values were derived from meal sample sizes as follows; triglyceride6h-rise, n = 920; glucoseiAUC0-2h, n = 958; C-peptide1h-rise, n = 960. TG = triglyceride, DBS = dried blood spots, CGM = continuous glucose monitor. * p<0.05, ** p<0.01, *** p<0.001 using multivariable linear regression.
