
Figure 3. Relationship of baseline values, genetic and microbiome factors to postprandial responses.
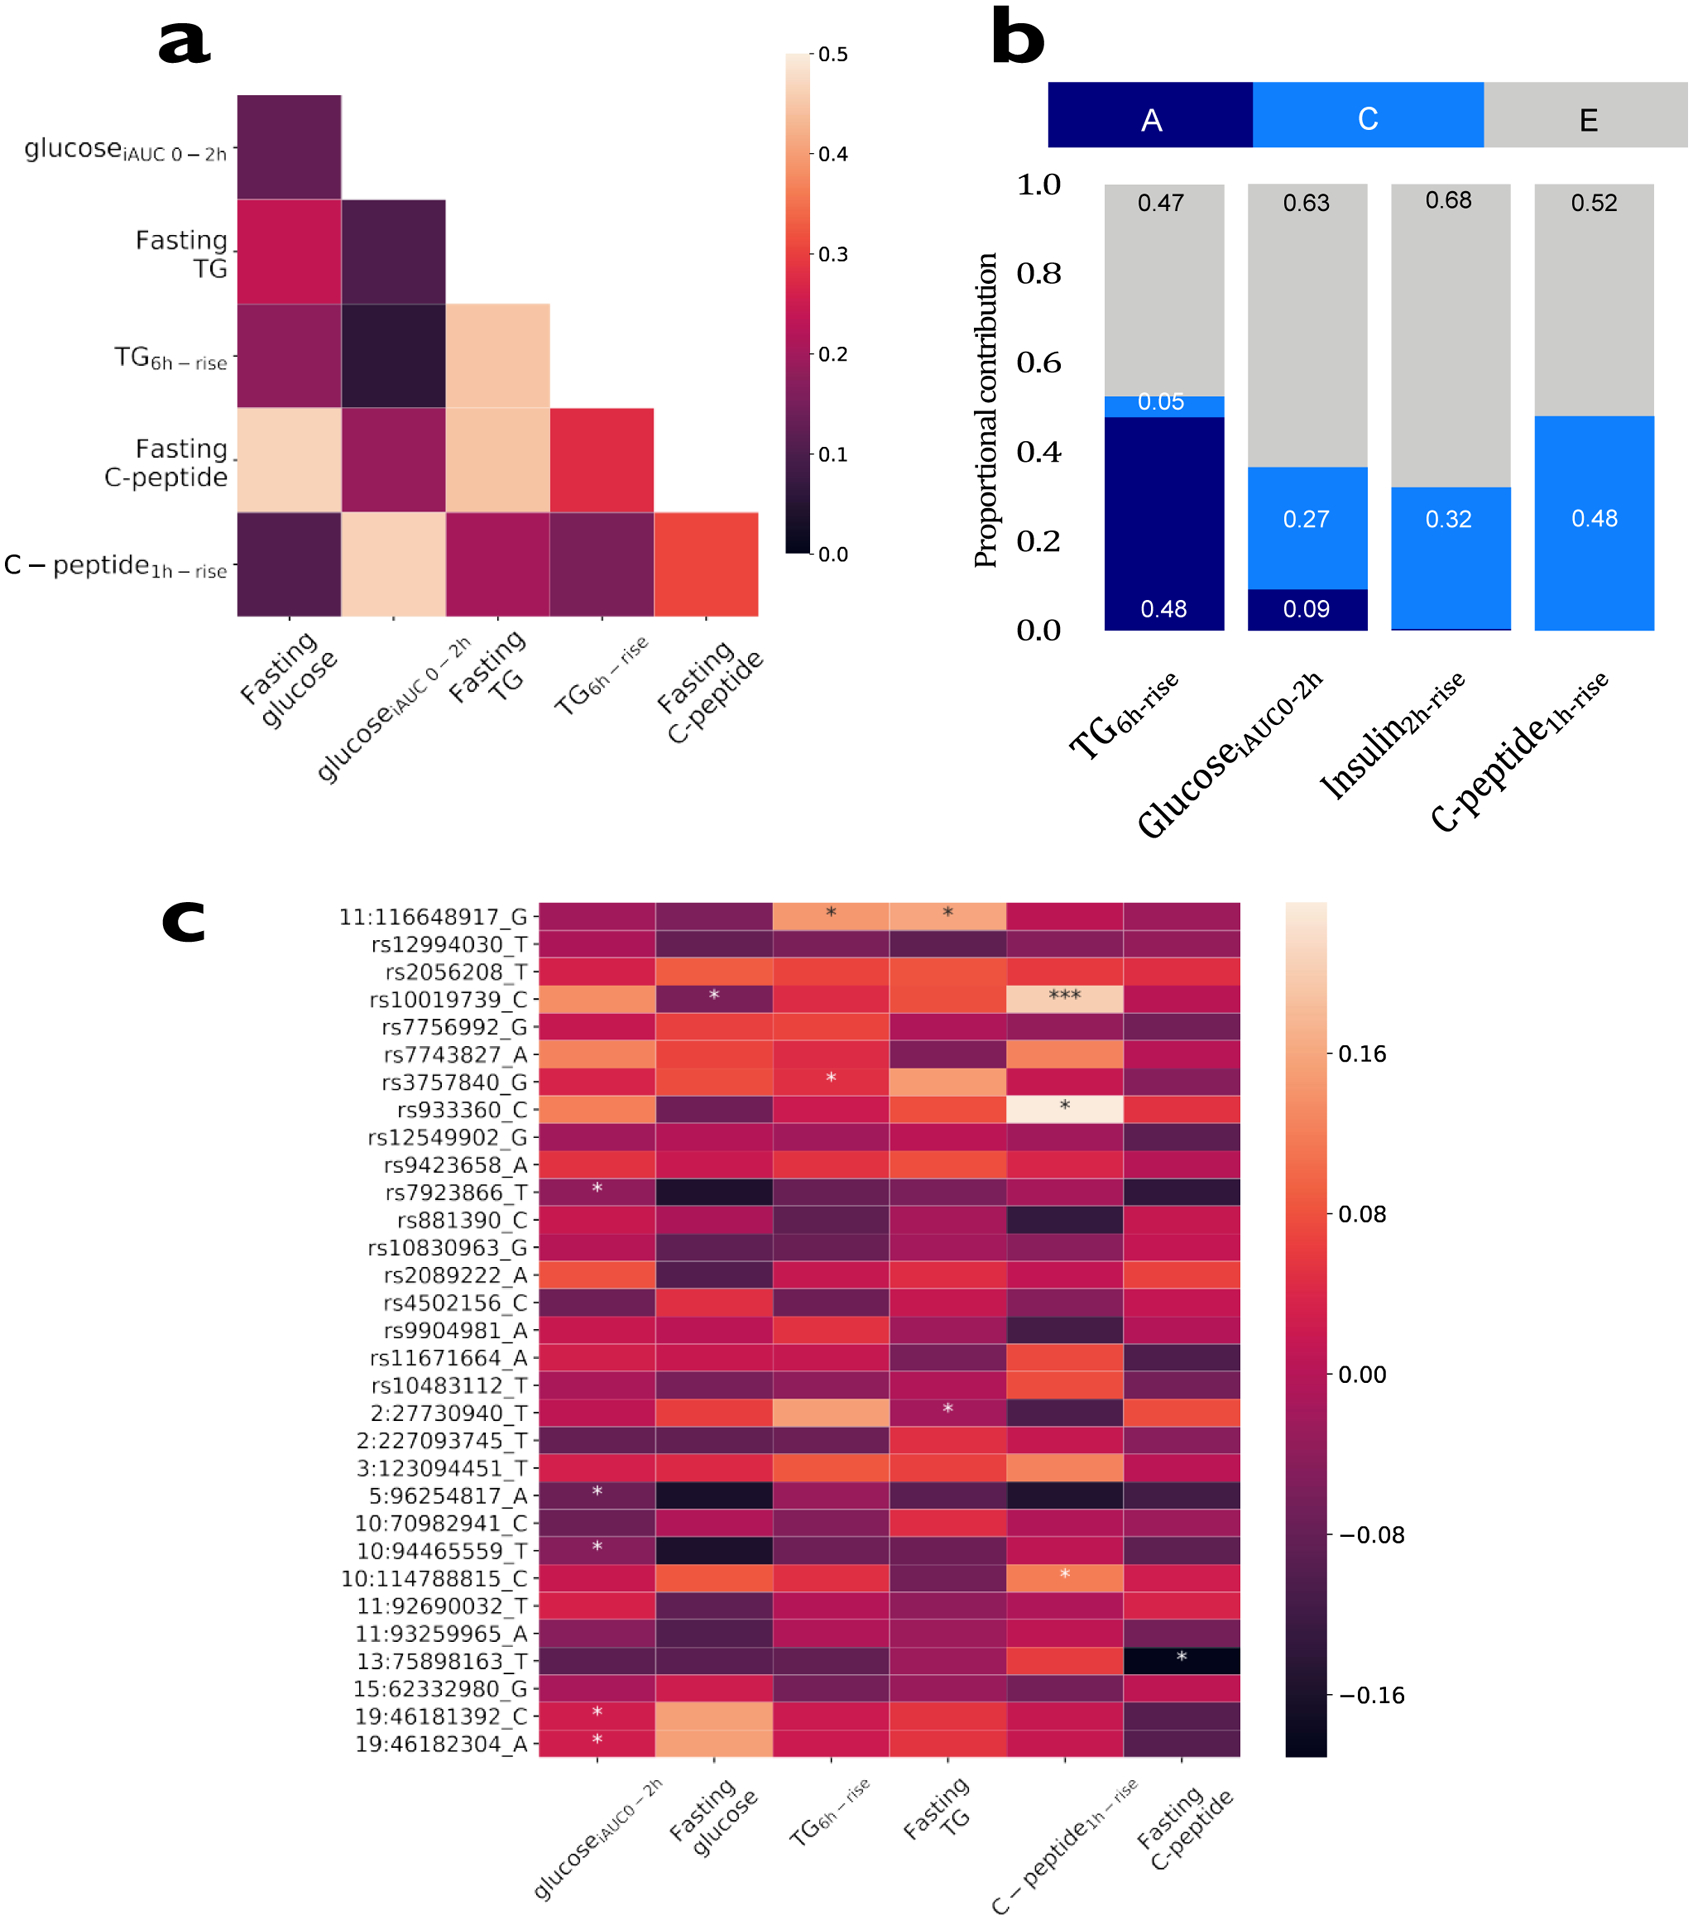
a. Pearson correlations between baseline values and postprandial prediction measures of 980 participants from the UK cohort. b. Heritability of postprandial responses (the ACE model was fitted on log-scaled postprandial responses for triglyceride, glucose, insulin and C-peptide) in 183 MZ and 47 DZ twin pairs. A; additive genetic component, C; shared environmental component, E; individual environmental component. c. SNP associations with postprandial measures focusing on SNPs identified in published postprandial trait GWAS17–21 (n = 241; * p<0.05, *** p<0.001, using two-sided chi-squared test).