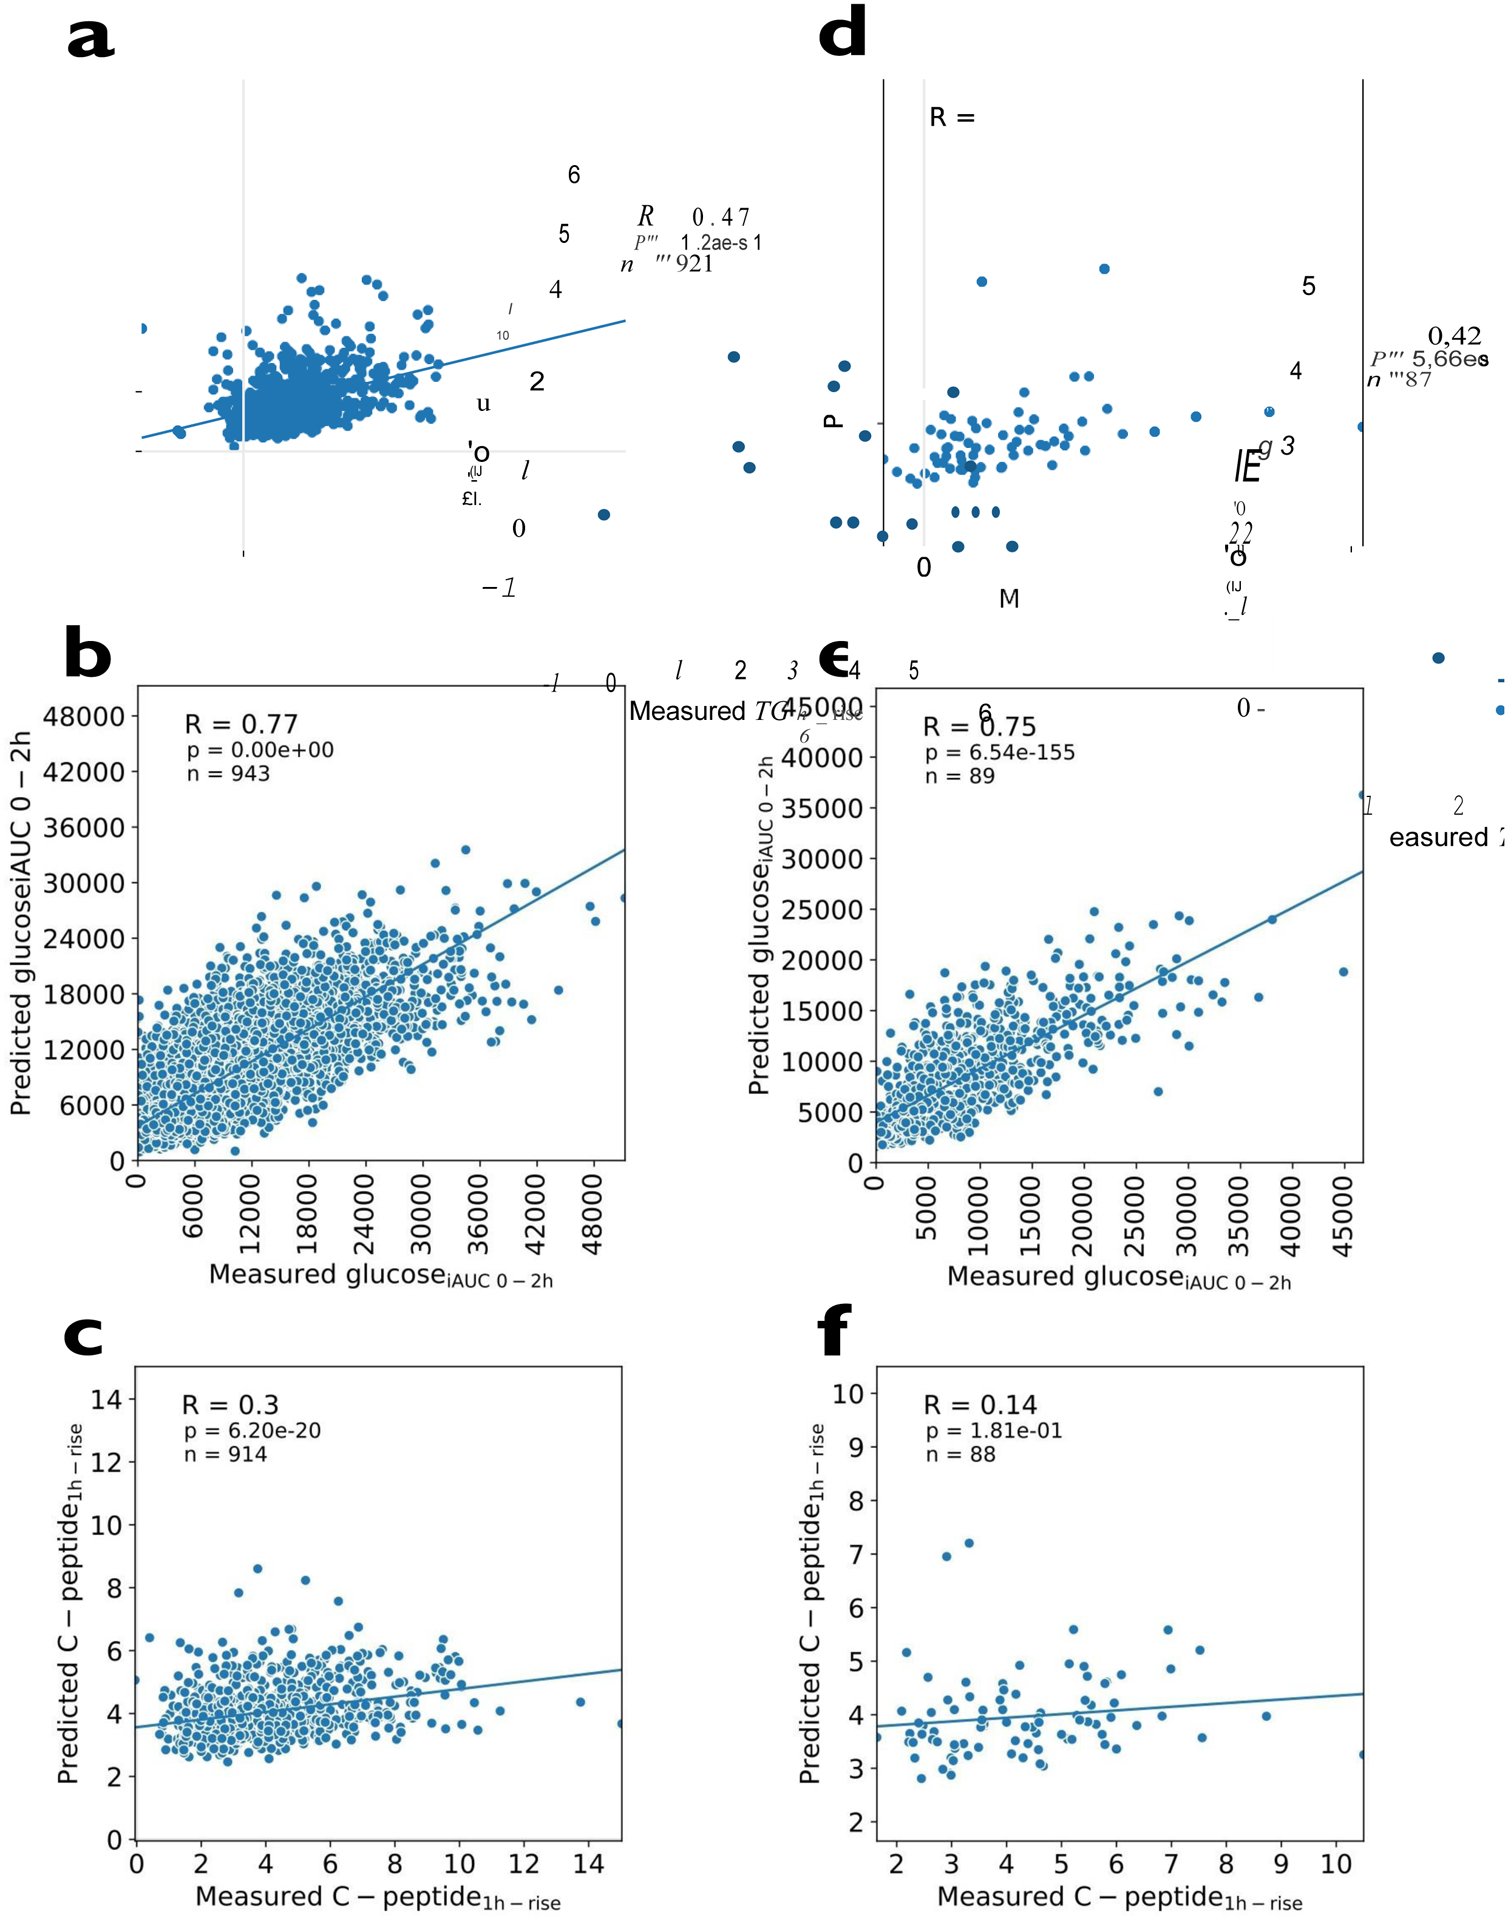
Figure 4 -. Machine learning models fitted in to postprandial measures.

a. Machine learning model for TG6h-rise in the UK cohort. b. Machine learning model for glucoseiAUC0-2h in the UK cohort. c. Machine learning model for C-peptide1h-rise postprandial responses in the UK cohort. The machine learning models in the US validation cohort are shown in Figures 4 d-f. The relationship between variables is expressed as Pearson’s correlation coefficient (r) and denoted with a regression line; n represents participant number; the features used to predict each value are the same as those listed in the linear models in Figure 2b–d.
