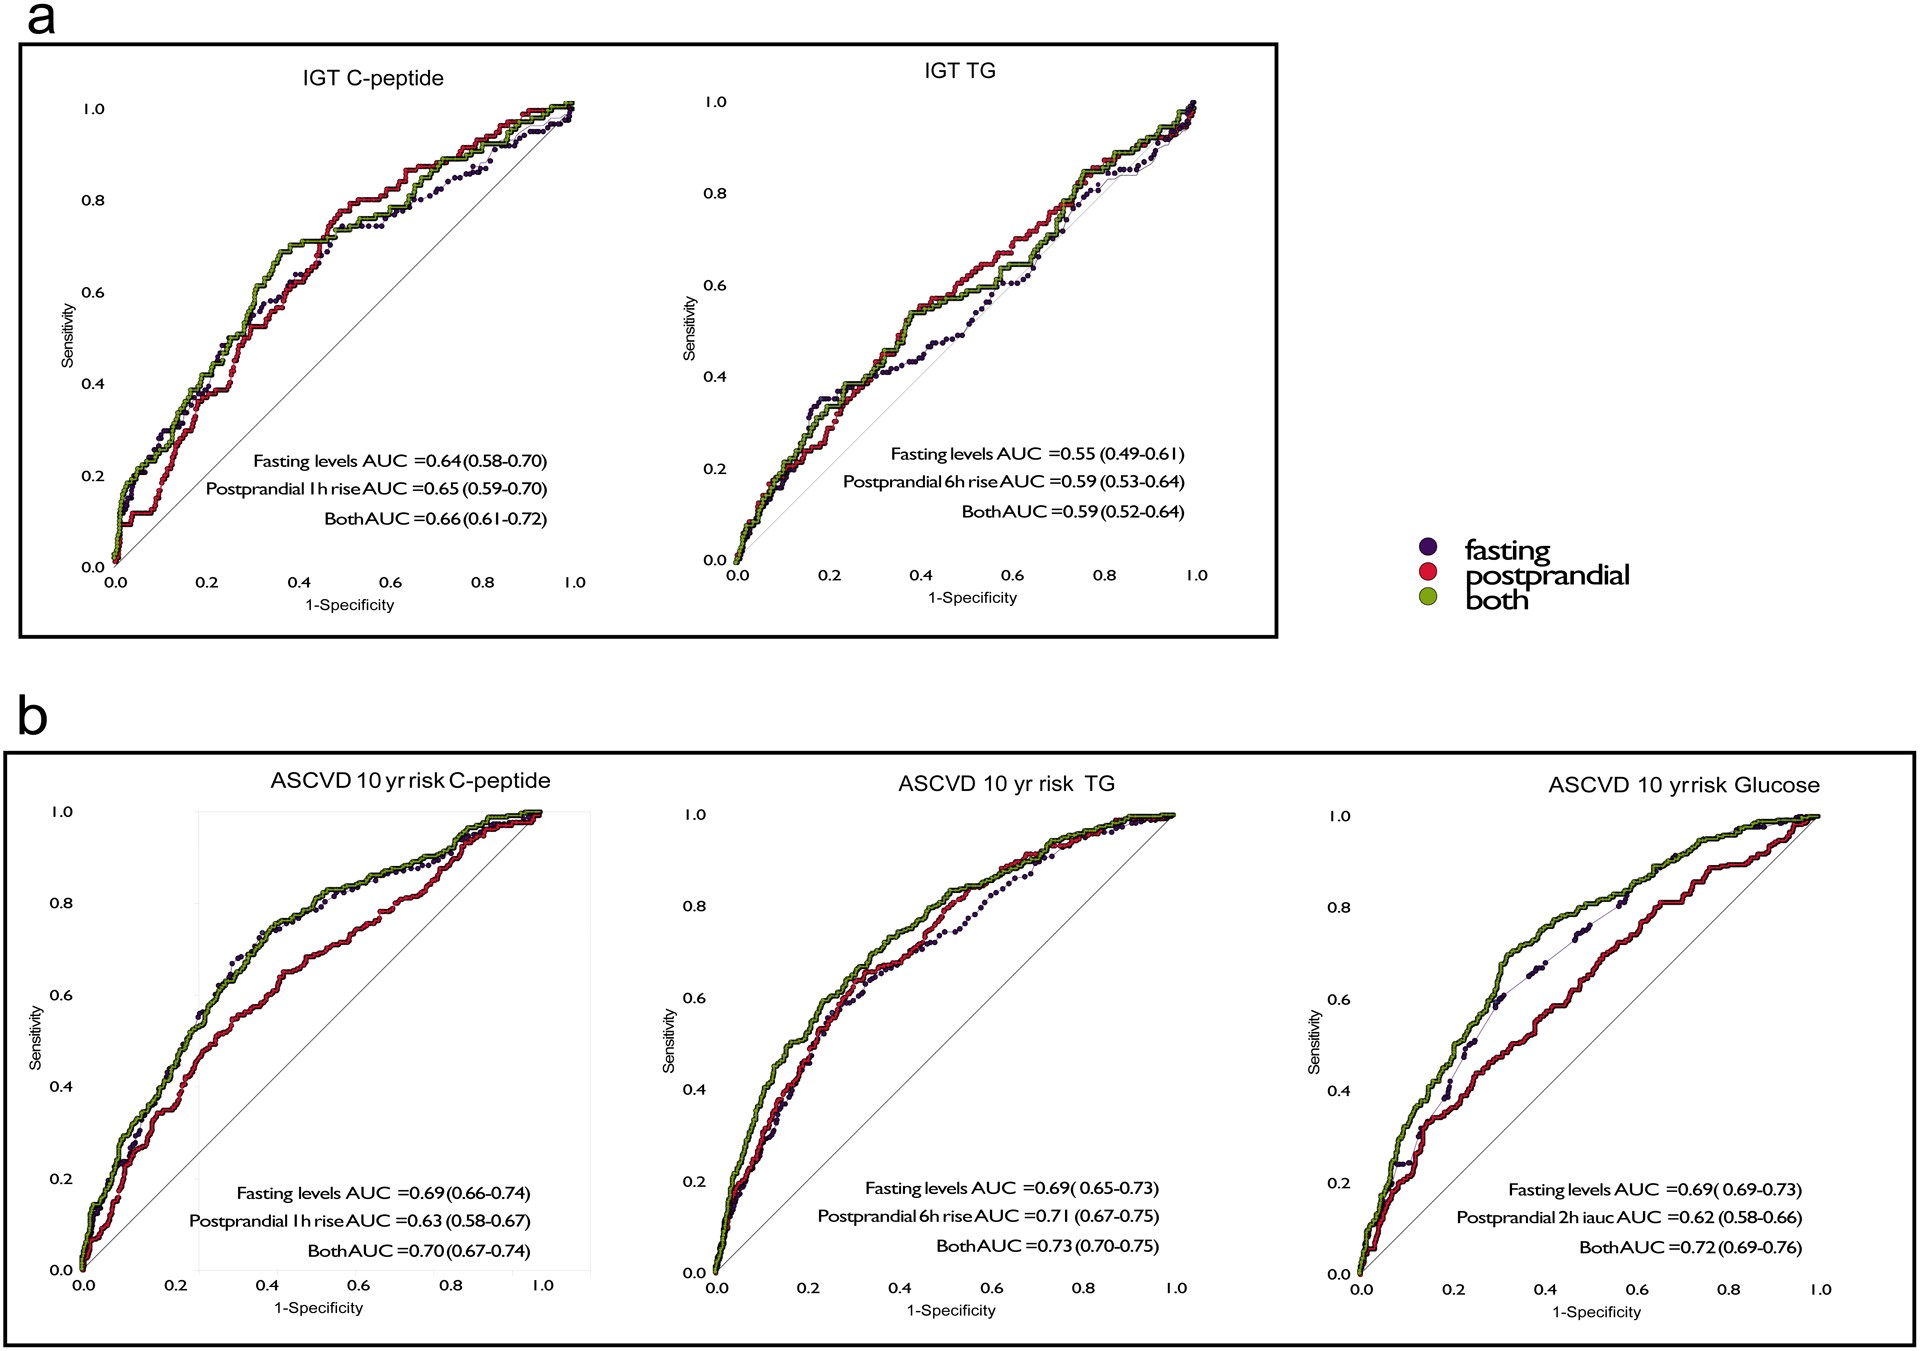
Figure 5. Associations between fasting and postprandial values for TG, C-peptide and glucose concentrations with clinical measures in the UK cohort.

Receiver operator characteristics curves illustrating the predictive utility of fasting and postprandial TG, glucose and C-peptide measures to discriminate the bottom 70% from the top 30% of the cohort (cut-off ASCVD 10 year risk of 0.0183) for a. atherosclerotic cardiovascular disease (ASCVD) 10-year risk n = 951 independent samples from the UK and b. impaired glucose tolerance (IGT) n = 826 independent samples from the UK. The same analyses were performed in the US cohort (n = 92 independent samples) resulting in ROC AUC (95%CI) values for ASCVD 10 year risk of: C-peptide fasting AUC = 0.68 (0.56–0.80), postprandial AUC = 0.66 (0.54–0.77), both AUC = 0.69 (0.58–0.81); TG fasting AUC = 0.73(0.63–0.84), postprandial AUC = 0.75 (0.65–0.85), both AUC = 0.77 (0.67–0.88); and glucose fasting AUC = 0.74-(0.63–0.85), postprandial AUC = 0.64 (0.52–0.76), both AUC = 0.76 (0.64–0.85). For impaired glucose tolerance values were: C-peptide fasting AUC = 0.66 (0.53–0.80), postprandial AUC = 0.59 (0.46–0.72), both AUC = 0.67 (0.54–0.80); and Triglyceride fasting AUC = 0.66 (0.53–0.80), postprandial AUC = 0.59 (0.46–0.72), both AUC = 0.61 (0.54–0.80).
