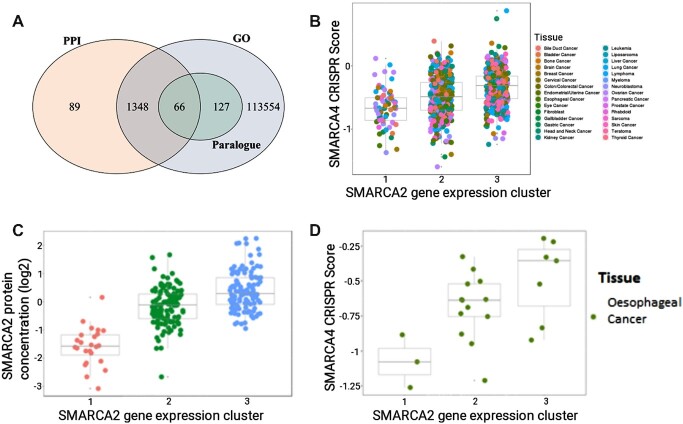
Figure 2.
Dependencies between CRISPR essentiality scores and MultiSEp clusters. (A) Venn diagram showing 115,184 gene pairs that pass the SynLeGG inclusion thresholds (P< 0.1, log2 fold-change > 0.1) and have overlapping Gene Ontology (GO) annotations, protein–protein interactions (PPIs) or are Ensembl human paralogues. As might be expected, all 193 paralogue pairs have a common GO term. (B) SMARCA4 CRISPR scores are visualized within MultiSEp clusters for SMARCA2 across 783 cell lines, coloured by thirty tissue groupings (see key). Essential and non-essential genes have median CRISPR scores of -1 and 0, respectively. As expected, SMARCA2 gene expression correlates with SMARCA4 CRISPR score; cell viability or growth is most damaged by loss of SMARCA4 in cell lines within low SMARCA2 expression clusters. (C) SynLeGG provides visualization of mass spectrometry proteomics data, where available. The figure shows SMARCA2 protein concentrations for the MultSEp gene expression clusters. The distribution of protein concentrations within each cluster follows the same trend as the mRNA measurements in matched cell lines, for example cluster 1 left) has low expression, providing evidence for chemical inhibition of SMARCA2 as a viable therapeutic strategy in cancers with low SMARCA4 activity. (D) The synthetic lethal relationship between SMARCA2 and SMARCA4 is shown for oesophageal cancer cell lines, accessed using the ‘Tissue Type’ mode in SynLeGG.

