Figure 3.
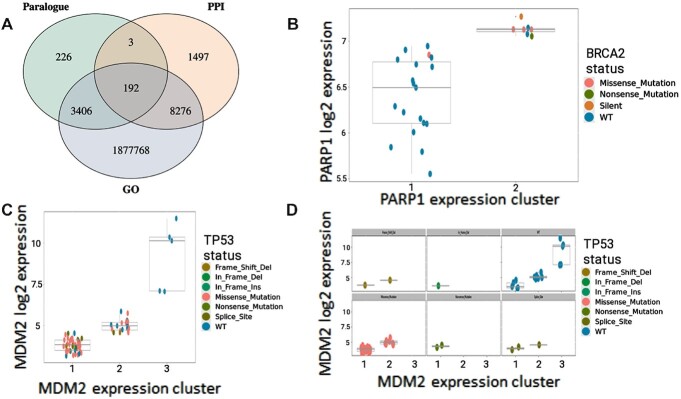
SynLeGG enables exploration of relationships between gene expression clusters and mutational status. (A) Venn diagram showing 1 891 368 gene pairs with candidate dependencies between mutations and MultiSEp clusters (P< 0.05, ≥5 mutations), which also have overlapping Gene Ontology (GO) annotations, protein-protein interactions (PPIs) or are Ensembl human paralogues. (B–D) visualize established dependency relationships between gene expression and mutational status. Gene expression values are given on the y-axis and MultiSEp clusters are indicated on the x-axis. Each cell line is coloured by mutational status according to the key. (B) shows an established synthetic lethal relationship between BRCA2 and PARP1 in oesophageal cancer cell lines. As expected, cell lines with low PARP1 expression are BRCA2 wild-type (blue), while the majority of cell lines with high PARP1 expression have BRCA2 mutations. (C) and (D) identify an ‘induced dependency’ relationship between TP53 mutations and MDM2 expression in brain cancer cell lines. MDM2 is a negative regulator of TP53 and all of the cell lines with high MDM2 expression are TP53 wild-type (blue); conversely the greatest proportion of TP53 mutations are found in the lowest MDM2 expression cluster. These data underline the attractiveness of MDM2 inhibitors in TP53 wild-type cancers. Separate plots for different mutation types are shown in (D); six plots appear in the Figure, however up to nine may be shown in SynLeGG.

