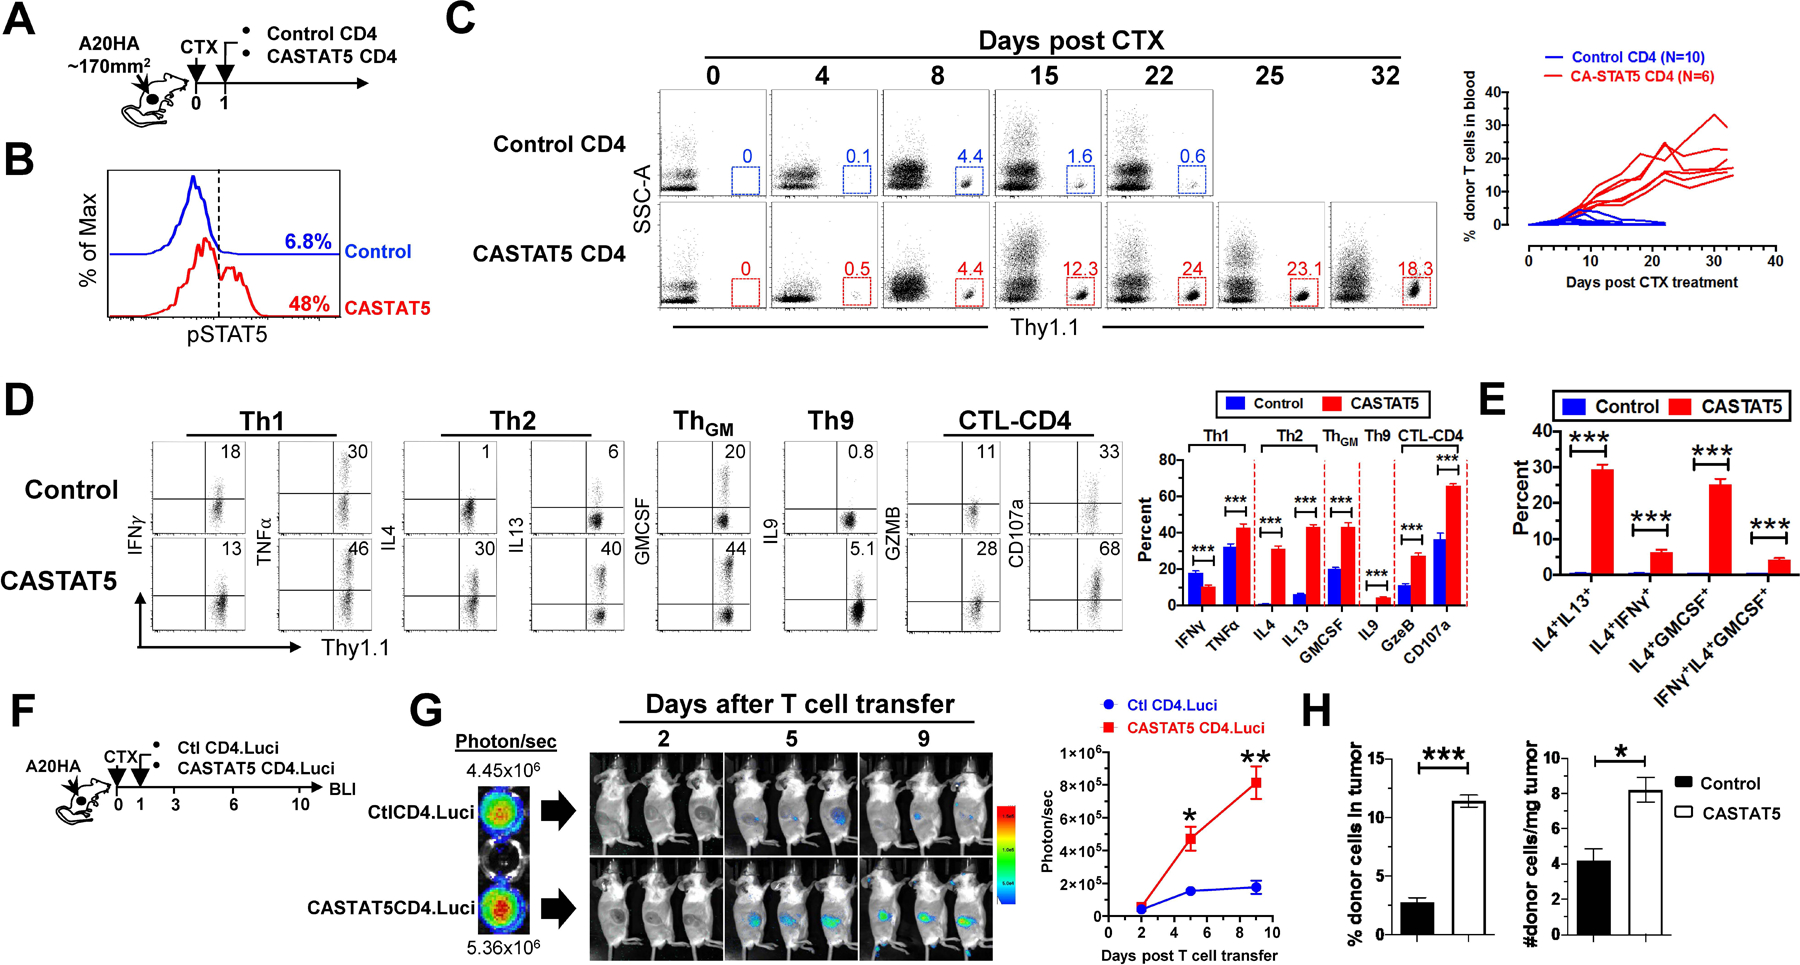
Fig. 1. CASTAT5-transduced CD4+ T cells undergo vigorous expansion, acquire a polyfunctional phenotype and robustly infiltrate the tumor upon adoptive transfer.

(A) The schema depicts the timeline of experimental procedures. (B) Detection of pSTAT5 in donor CD4+ T cells before adoptive transfer. The levels of phosphorylated STAT5 (pSTAT5) in mock-transduced (Control) or CASTAT5-transduced HA-specific CD4+ T cells were determined by flow cytometry. Numbers indicate the percent of pSTAT5+ cells in total CD4+ T cells. (C) Kinetics of donor CD4+ T cell expansion in peripheral blood. At the indicated time points, blood was collected from each mouse via tail vein and analyzed for the frequency of the donor T cells by flow cytometry. Representative dot plots at specific time points are shown, and the numbers represent the percentages of donor CD4+ T cells. The graph at right summarizes the frequencies of donor T cells against time. The number of mice in each group is given. (D) Cytokine profiles of donor CD4+ T cells. Ten days after T cell transfer, spleen cells were harvested and subjected to intracellular cytokine staining (ICS) following a transient stimulation with HA peptide. Representative dot plots shown depict the cytokine profiles of the donor CD4+ T cells. Numbers indicate the percentages of cytokine-producing cells in total donor CD4+ T cells. The results shown as mean ± s.d. are summarized in the bar graph at right. Data are pooled from three independent experiments. (E) Polyfunctional status of the donor CD4+ T cells. Bar graph summarizes the percent of donor CD4+ T cells co-expressing the indicated cytokines. (F-H) Migration and retention of donor CD4+ T cells in tumor. (F) The schema depicts the experimental procedures. HA-specific CD4+ T cells were transduced with luci-carrying retrovirus alone (Ctl CD4.Luci) or co-transduced with luci- and CASTAT5-carrying retrovirus (CASTAT5 CD4.Luci). Before T cell transfer, BLI was conducted for T cells in vitro to evaluate the transduction efficiency of luciferase gene (G, left panel). After T cell transfer, BLI was conducted periodically to visualize luciferase-expressing donor CD4+ T cells in vivo. Representative images of mice in each group at specific time points are shown (G, middle panel). Results of in vivo T cell luciferase signal intensity quantified as mean ± s.d. of three mice per group are summarized in graph shown at right. The enhanced infiltration and accumulation of CASTAT5 CD4+ T cells in tumor compared to control CD4+ T cells was confirmed by flow cytometry analysis and cell counting (H). Following the experimental procedures depicted in (A), tumor masses were excised and analyzed 7 days after T cell transfer. The frequencies of tumor-infiltrating donor CD4+ T cells were examined by flow cytometry and summarized in bar graph (H, left panel). The absolute donor CD4+ T cell numbers in tumor are normalized to the weight of tumor mass (H, right panel). The formula for calculating donor CD4+ T cell numbers is: total cell number x percent of donor CD4+ T cells. Data are shown as mean ± s.d. of three mice per group. *p < 0.05, **p < 0.01, ***p < 0.001.
